• Journal of Applied Optics
  • Vol. 43, Issue 4, 809 (2022)
Jiahui QU1,1,1,1,1,1, Haiyang ZHANG1,1,1,1,1,1,*, Yu FAN1,1,1, Lin WANG1,1,1,1,1,1..., Heying WANG1,1,1,1,1,1 and Changming ZHAO1,1,1,1,1,1|Show fewer author(s)
Author Affiliations
  • 11Key Laboratory of Photoelectronic Imaging Technology and System (Ministry of Education), Beijing Institute of Technology, Beijing 100081, China
  • 12School of Optics and Photonics, Beijing Institute of Technology, Beijing 100081, China
  • 13Key Laboratory of Optoelectronic Countermeasure Testing and Evaluation Technology, Luoyang 471003, China
  • show less
    DOI: 10.5768/JAO202243.0407004 Cite this Article
    Jiahui QU, Haiyang ZHANG, Yu FAN, Lin WANG, Heying WANG, Changming ZHAO. Mechanism of multi-wavelength laser detection of micro-camera[J]. Journal of Applied Optics, 2022, 43(4): 809 Copy Citation Text show less
    Laser active detection model of cat-eye target
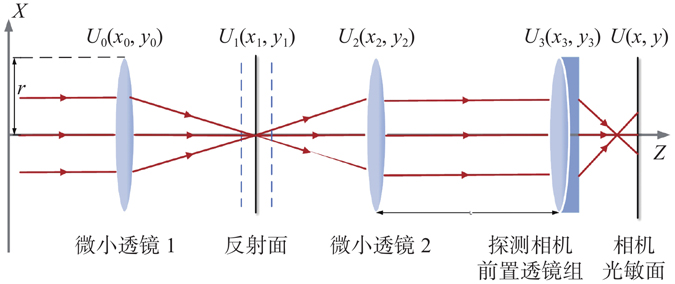
    Fig. 1. Laser active detection model of cat-eye target
    Schematic diagram of depth of field of imaging system
    Fig. 2. Schematic diagram of depth of field of imaging system
    Structure diagram of experimental device
    Fig. 3. Structure diagram of experimental device
    532 nm laser echo spot and intensity distribution curve
    Fig. 4. 532 nm laser echo spot and intensity distribution curve
    852 nm laser echo spot and intensity distribution curve
    Fig. 5. 852 nm laser echo spot and intensity distribution curve
    1 064 nm laser echo spot and intensity distribution curve
    Fig. 6. 1 064 nm laser echo spot and intensity distribution curve
    1 550 nm laser echo spot and intensity distribution curve
    Fig. 7. 1 550 nm laser echo spot and intensity distribution curve
    Relation curves of total irradiation intensity of detection surface and detection distance
    Fig. 8. Relation curves of total irradiation intensity of detection surface and detection distance
    Relation curves of spot radius and detection distance
    Fig. 9. Relation curves of spot radius and detection distance
    Experimental diagram of 532 nm laser echo spot
    Fig. 10. Experimental diagram of 532 nm laser echo spot
    Experimental diagram of 852 nm laser echo spot
    Fig. 11. Experimental diagram of 852 nm laser echo spot
    Experimental diagram of 1 064 nm laser echo spot
    Fig. 12. Experimental diagram of 1 064 nm laser echo spot
    Experimental diagram of 1 550 nm laser echo spot
    Fig. 13. Experimental diagram of 1 550 nm laser echo spot
    参数规格
    面阵工业相机短波红外相机
    光谱响应范围/nm300~1 100400~1 700
    像元数(高×宽)/pixel2 592×2 0481 296×1 032
    芯片尺寸/mm168
    像元尺寸/μm4.8×4.85.0×5.0
    帧率/(帧/s)6066
    Table 1. Specification parameters of industrial camera
    序号类型波长/nm发射功率/mW
    1可见光53210
    2近红外85210
    3近红外1 06410
    4短波红外1 55010
    Table 2. Description of commonly-used detection laser
    波长/nm探测距离/m
    0.5~11~1.51.5~22~2.52.5~3
    532−0.080 80.089 25.776 6−5.852−0.149 2
    852−0.044 20.055 81.906 6−1.976 6−0.069 6
    1 0640.223 40.083 84.041 2−4.138 4−0.151 0
    1 550−0.481 80.749 610.084 0−10.162 2−1.685 0
    Table 3. Segmentation slope of relation curves of total irradiation intensity of detection surface and detection distance (×10−3 W/mm3
    波长/nm探测距离/m
    0.5123
    532条纹清晰,中央亮条纹外衍射环密集衍射环半径减小,回波能量向中心会聚光斑聚焦程度高,此时猫眼目标回波中心光强为极大值光斑外扩,衍射特征明显
    852条纹较模糊,光斑级次减少,各级条纹的间距较大衍射环半径减小,回波能量向中心会聚光斑聚焦程度较高,此时猫眼目标回波中心光强为极大值光斑半径增加,探测面接收能量低
    1 064条纹较模糊,光斑级次减少,各级条纹的间距较大衍射环半径减小,回波能量向中心会聚光斑聚焦程度较高,此时猫眼目标回波中心光强为极大值光斑半径增加,探测面接收能量极低
    1 550条纹较清晰,光斑级次减少,各级条纹的间距大衍射环半径减小,回波能量向中心会聚光斑聚焦程度高,此时猫眼目标回波中心光强为极大值光斑外扩明显,探测面接收能量高
    Table 4. Spot characteristics of different-wavelength lasers at partial detection distances
    Jiahui QU, Haiyang ZHANG, Yu FAN, Lin WANG, Heying WANG, Changming ZHAO. Mechanism of multi-wavelength laser detection of micro-camera[J]. Journal of Applied Optics, 2022, 43(4): 809
    Download Citation