
Zheng LI, Yi MU, Jingyuan LIANG, Mu LI, Xizheng KE. Application of LC-SLM in Adaptive Optics[J]. Study On Optical Communications, 2024, 50(2): 22007301
- Study On Optical Communications
- Vol. 50, Issue 2, 22007301 (2024)
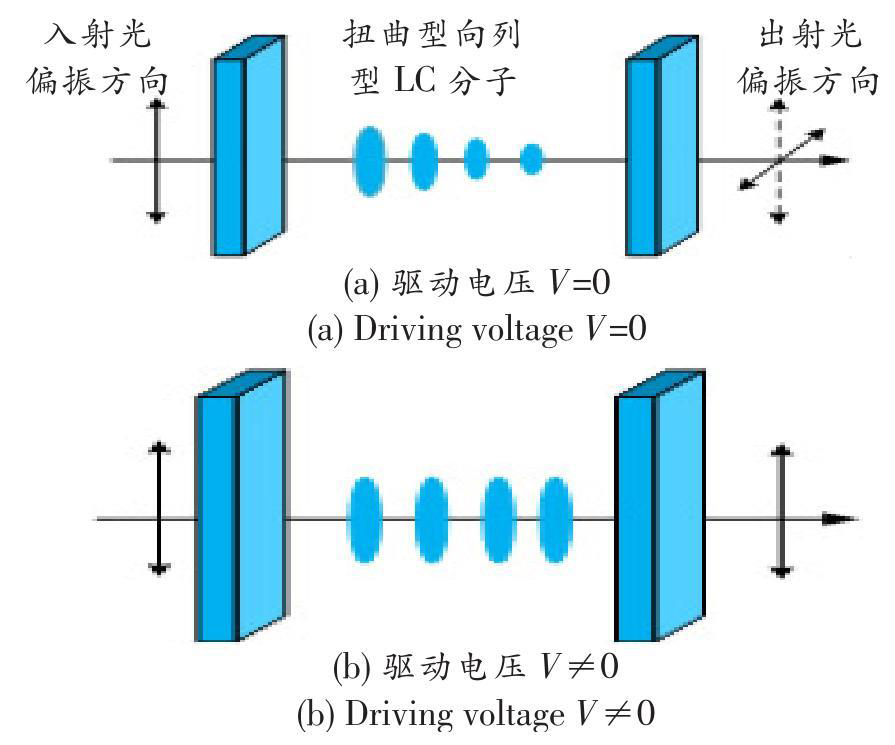
Fig. 1. TN-LC SLM operation principle
![PA-NLC SLM working mode[14]](/richHtml/gtxyj/2024/50/2/22007301/img_02.jpg)
Fig. 2. PA-NLC SLM working mode[14]
Fig. 3. Refractive index ellipsoid
Fig. 4. Schematic diagram of double seam interference
Fig. 5. Schematic diagram of Teyman-Green interference
Fig. 6. Schematic diagram of four SLM
Fig. 7. Schematic diagram of wavefront conjugation
Fig. 8. Simulation block diagram of turbulence effect system
Fig. 9. Amplitude of difference frequency signal before correction[22]
Fig. 10. Amplitude of difference frequency signal after correction[22]
Fig. 11. Difference frequency signal amplitude before and after correction[22]
Fig. 12. Power spectrum of difference frequency signal before and after correction[22]
Fig. 13. Received signal constellation before correction by AO system[22]
Fig. 14. Received signal constellation corrected by AO system[22]
Fig. 15. Experimental schematic diagram of dual LC-SLM structure correction of distorted light[33]
Fig. 16. The light spot diagram before and after algorithm iteration at D/r0=2[33]
Fig. 17. The light spot diagram before and after the algorithm iteration at D/r0=10[33]
Fig. 18. The light spot diagram before and after the algorithm iteration at D/r0=20[33]
Fig. 19. SR variation curve of the system under different turbulence conditions[33]
Fig. 20. Adaptive system of deformable mirror-LC-SLM structure[34]
Fig. 21. Light spot and SR curve before and after algorithm iteration at l=520.0 nm[34]
Fig. 22. Light spot and SR curve before and after algorithm iteration at l=632.8 nm[34]
Fig. 23. Light spot and SR curve before and after algorithm iteration at l=980 nm[34]
Fig. 24. Light spot and SR curve before and after algorithm iteration at l=1 550 nm[34]


Set citation alerts for the article
Please enter your email address

© Copyright 2018-2021 | Chinese Laser Press. All Rights Reserved 沪ICP备15018463号-20