• Journal of Atmospheric and Environmental Optics
  • Vol. 19, Issue 1, 22 (2024)
GU Taofeng1, YUE Haiyan2,*, WANG Sihua3, WU Guangsheng1..., FENG Houwen4, TANG Ziheng5, ZHUANG Peng5,6,7, KANG Baorong5 and XIE Chenbo5,6,7|Show fewer author(s)
Author Affiliations
  • 1Guangzhou Emergency Early Warning Release Center, Guangzhou 511430, China
  • 2Guangzhou Meteorological Observatory, Guangzhou 511430, China
  • 3Guangzhou Huangpu Meteorological Administration, Guangzhou 510700, China
  • 4Guagnzhou Division of Monitoring and Networkingr, Guangzhou 511430, China
  • 5Anhui Lanke Information Technology Co., Ltd, Hefei 230031, China
  • 6Key Laboratory of Atmospheric Optics, Anhui Institute of Optics and Fine Machinics, HFIPS,Chinese Acaemy of Sciences, Hefei 230031, China
  • 7Advanced Laser Technology Anhui Provincial Laboratory, Hefei 230000, China
  • show less
    DOI: 10.3969/j.issn.1673-6141.2024.01.002 Cite this Article
    Taofeng GU, Haiyan YUE, Sihua WANG, Guangsheng WU, Houwen FENG, Ziheng TANG, Peng ZHUANG, Baorong KANG, Chenbo XIE. A coherent wind lidar based on Doppler principle and its field application[J]. Journal of Atmospheric and Environmental Optics, 2024, 19(1): 22 Copy Citation Text show less
    Schematic diagram of coherent wind lidar measurement principle
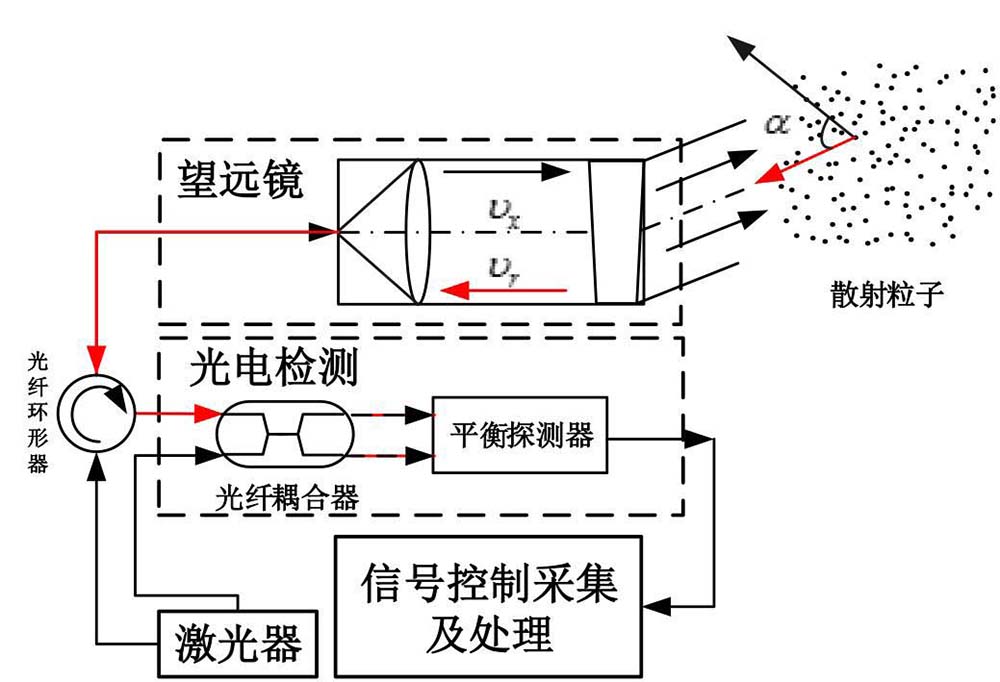
    Fig. 1. Schematic diagram of coherent wind lidar measurement principle
    Schematic diagram of VAD method for retrieving wind speed in atmospheric wind field
    Fig. 2. Schematic diagram of VAD method for retrieving wind speed in atmospheric wind field
    Schematic diagram of coherent wind lidar system structure
    Fig. 3. Schematic diagram of coherent wind lidar system structure
    The physical picture of coherent wind lidar. (a) Experimental set; (b) appearance
    Fig. 4. The physical picture of coherent wind lidar. (a) Experimental set; (b) appearance
    Scene picture of coherent wind lidar system in Huangpu District, Guangzhou City
    Fig. 5. Scene picture of coherent wind lidar system in Huangpu District, Guangzhou City
    Probability density distribution diagram of horizontal wind speed of coherent wind lidar at different heights.(a) 510 m; (b) 1070 m; (c) 1490 m; (d) 2050 m
    Fig. 6. Probability density distribution diagram of horizontal wind speed of coherent wind lidar at different heights.(a) 510 m; (b) 1070 m; (c) 1490 m; (d) 2050 m
    Probability density distribution diagram of horizontal wind speed of wind profiler radar at different heights.(a) 510 m; (b) 1070 m; (c) 1490 m; (d) 2050 m
    Fig. 7. Probability density distribution diagram of horizontal wind speed of wind profiler radar at different heights.(a) 510 m; (b) 1070 m; (c) 1490 m; (d) 2050 m
    Wind direction rose diagram of coherent wind lidar at different heights. (a) 510 m; (b) 1070 m; (c) 1490 m; (d) 2050 m
    Fig. 8. Wind direction rose diagram of coherent wind lidar at different heights. (a) 510 m; (b) 1070 m; (c) 1490 m; (d) 2050 m
    Wind direction rose diagram of wind profiler radar at different heights. (a) 510 m; (b) 1070 m; (c) 1490 m; (d) 2050 m
    Fig. 9. Wind direction rose diagram of wind profiler radar at different heights. (a) 510 m; (b) 1070 m; (c) 1490 m; (d) 2050 m
    Comparisons of horizontal wind speed profiles (a) and wind direction profiles (b) between wind profile radar and coherent wind lidar at 22:48 on October 16, 2021
    Fig. 10. Comparisons of horizontal wind speed profiles (a) and wind direction profiles (b) between wind profile radar and coherent wind lidar at 22:48 on October 16, 2021
    Difference of horizontal wind speeds (a) and wind directions (b) and relative error of wind speed (c) between wind profiler radar and coherent wind lidar at 22:48 on October 16, 2021
    Fig. 11. Difference of horizontal wind speeds (a) and wind directions (b) and relative error of wind speed (c) between wind profiler radar and coherent wind lidar at 22:48 on October 16, 2021
    Time series plot of horizontal wind speed and wind direction from 10:00 on October 18, 2021 to 00:00 on October 19, 2021
    Fig. 12. Time series plot of horizontal wind speed and wind direction from 10:00 on October 18, 2021 to 00:00 on October 19, 2021
    Time series plot of vertical wind speed and wind direction from 10:00 on October 18, 2021 to 00:00 on October 19, 2021
    Fig. 13. Time series plot of vertical wind speed and wind direction from 10:00 on October 18, 2021 to 00:00 on October 19, 2021
    Time series plot of temperature and relative humidity at the near surface from 10:00 on October 18, 2021 to 00:00 on October 20, 2021
    Fig. 14. Time series plot of temperature and relative humidity at the near surface from 10:00 on October 18, 2021 to 00:00 on October 20, 2021
    Time series plot of horizontal wind speed and wind direction from 00:00 on October 19, 2021 to 00:00 on October 20, 2021
    Fig. 15. Time series plot of horizontal wind speed and wind direction from 00:00 on October 19, 2021 to 00:00 on October 20, 2021
    Time series plot of vertical wind speed and wind direction from 00:00 on October 19, 2021 to 00:00 on October 20, 2021
    Fig. 16. Time series plot of vertical wind speed and wind direction from 00:00 on October 19, 2021 to 00:00 on October 20, 2021
    Technical parameterValue
    Wavelength/nm1550
    Measuring range of height/m45-3000
    Measuring range of wind speed/(m·s-1)0-60
    Measuring range of wind direction/(°)0-360
    Repetition frequency/MHz400
    Horizontal wind direction error/(°)≤ 10
    Horizontal wind speed error/(m·s-1)≤ 0.8 (V ≤ 10 m·s-1)
    Vertical flow error/(m·s-1)≤ 0.5
    Detection blind spot/m≤ 45
    Spatial resolution/m30/60/90
    Operating temperature/°C-10-50
    Weight/kg≤ 30
    Table 1. Design parameters of coherent wind lidar
    Height/mNumber of samplePearson correlation coefficientWind direction coincidence rate/%
    5101750.686*41.5
    6501730.837*31.4
    7901760.850*32.5
    9301770.902*33.7
    10701770.910*38.2
    12101730.829*30.3
    13501680.687*32.5
    14901650.675*29.2
    16301610.620*25.8
    17701580.547*20.2
    19101530.521*21.3
    20501500.482*17.9
    21901400.348*13.4
    Table 2. Comparison of horizontal wind direction and wind direction at different heights between coherent wind lidar and wind profiler radar from October 16 to 20,2021 at station in Huangpu District
    ParameterHeight/mPearson correlation coefficient

    Mean absolute

    difference

    Relative error/%Standard error
    Wind speed510-23500.9010.814 m·s-17.391.060 m·s-1
    Wind direction0.918 (> 800 m)23.81°
    Table 3. Comparisons of horizontal wind speed profiles and wind direction profiles between wind profiler radar and coherent wind lidar at 22:48 on October 16,2021
    ParameterInstrument typeNumber of samplesMean value

    Standard

    deviation

    Maximal valueMinimal valueWilcoxon test factor P
    Wind speedWind profiler radar529.5283.02014.5486.0200.299
    Coherent wind lidar529.7203.49516.5795.902
    Wind directionWind profiler radar5262.32023.12990.37814.1000.190
    Coherent wind lidar52100.817117.200358.9681.638
    Table 4. Non-parametric test results of horizontal wind speed profiles and wind direction profiles between wind profile radar and coherent wind lidar at 22:48 on October 16,2021
    Taofeng GU, Haiyan YUE, Sihua WANG, Guangsheng WU, Houwen FENG, Ziheng TANG, Peng ZHUANG, Baorong KANG, Chenbo XIE. A coherent wind lidar based on Doppler principle and its field application[J]. Journal of Atmospheric and Environmental Optics, 2024, 19(1): 22
    Download Citation