• Laser & Optoelectronics Progress
  • Vol. 62, Issue 3, 0306005 (2025)
Zhihui Luo1,2,*, Xiaolong Wang1, Yonghui Liang3, Xinjia Yu3, and Jianglou Huang1,2
Author Affiliations
  • 1College of Mathematics and Physics, College of Nuclear Energy Science and Engineering, China Three Gorges University, Yichang 443002, Hubei , China
  • 2Hubei Engineering Research Center for Weak Magnetic-Field Detection, China Three Gorges University, Yichang 443002, Hubei , China
  • 3Shanghai Shenyuan Geotechnical Engineering Co., Ltd., Shanghai 200011, China
  • show less
    DOI: 10.3788/LOP241167 Cite this Article Set citation alerts
    Zhihui Luo, Xiaolong Wang, Yonghui Liang, Xinjia Yu, Jianglou Huang. Migration Monitoring Method for Ancient Building Based on Ultra-Weak Fiber Bragg Grating[J]. Laser & Optoelectronics Progress, 2025, 62(3): 0306005 Copy Citation Text show less
    Optical cable strain transfer model
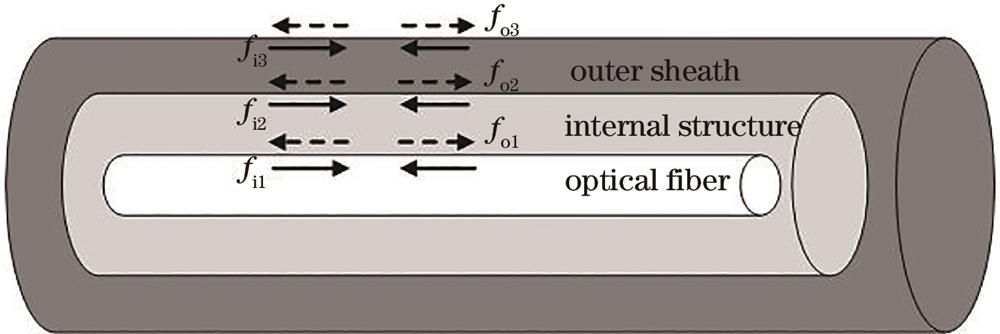
    Fig. 1. Optical cable strain transfer model
    Simulated structural meshing
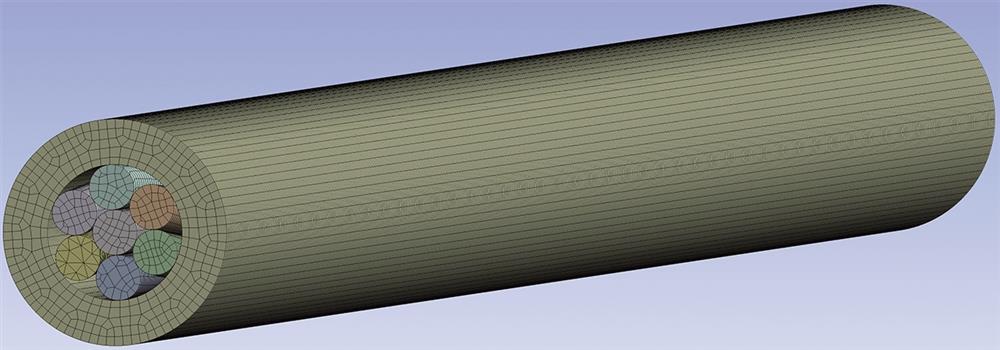
    Fig. 2. Simulated structural meshing
    Path strain at different locations. (a) Central strain; (b) outer strain
    Fig. 3. Path strain at different locations. (a) Central strain; (b) outer strain
    Schematic diagram of strain-curvature relationship
    Fig. 4. Schematic diagram of strain-curvature relationship
    Recursive principle of corner cutting
    Fig. 5. Recursive principle of corner cutting
    Structure of steel strand UW-FBG strain optical cable
    Fig. 6. Structure of steel strand UW-FBG strain optical cable
    Strain calibration curve of UW-FBG. (a) Wavelength of 1554 nm; (b) wavelength of 1542 nm; (c) wavelength of 1530 nm
    Fig. 7. Strain calibration curve of UW-FBG. (a) Wavelength of 1554 nm; (b) wavelength of 1542 nm; (c) wavelength of 1530 nm
    Temperature calibration curve of UW-FBG
    Fig. 8. Temperature calibration curve of UW-FBG
    Layout diagram of sensor cable
    Fig. 9. Layout diagram of sensor cable
    Migration process monitoring system
    Fig. 10. Migration process monitoring system
    Strain monitoring curves of pallet beam after concrete pouring. (a) Variation in strain in concrete curing process; (b) wavelength change after concrete complete curing
    Fig. 11. Strain monitoring curves of pallet beam after concrete pouring. (a) Variation in strain in concrete curing process; (b) wavelength change after concrete complete curing
    Strain distribution before, during and after translation of pallet beam
    Fig. 12. Strain distribution before, during and after translation of pallet beam
    Nonuniform settlement of pellet beam during moving process
    Fig. 13. Nonuniform settlement of pellet beam during moving process
    Nonuniform settlement of pallet beam after moving
    Fig. 14. Nonuniform settlement of pallet beam after moving
    ParameterFRPSteel nooseOuter sheath
    Elastic modulus /GPa721941
    Poisson’s ratio0.300.280.28
    Density /(g·cm-31.507.850.93
    Table 1. Structural parameters of each layer
    Pulling force /NCenter strain /μεOuter strain /μεStrain transfer efficiency /%
    000
    5013.114.888.5
    10025.528.988.2
    15038.143.388.0
    20051.758.288.8
    25063.472.587.4
    Table 2. Average strains at different locations under different pulling forces
    Zhihui Luo, Xiaolong Wang, Yonghui Liang, Xinjia Yu, Jianglou Huang. Migration Monitoring Method for Ancient Building Based on Ultra-Weak Fiber Bragg Grating[J]. Laser & Optoelectronics Progress, 2025, 62(3): 0306005
    Download Citation