• Laser & Optoelectronics Progress
  • Vol. 62, Issue 5, 0506004 (2025)
Yinuo Fang*, Qianqian Huang, Kaiquan Yan, Zishuo Xu..., Mingjiao Wang, Kai Wang, Yuehui Ma, Weixi Li, Yunqi Liu and Chengbo Mou|Show fewer author(s)
Author Affiliations
  • Key Laboratory of Specialty Fiber Optics and Optical Access Networks, Shanghai University, Shanghai 200444, China
  • show less
    DOI: 10.3788/LOP241446 Cite this Article Set citation alerts
    Yinuo Fang, Qianqian Huang, Kaiquan Yan, Zishuo Xu, Mingjiao Wang, Kai Wang, Yuehui Ma, Weixi Li, Yunqi Liu, Chengbo Mou. High-Capacity, High-Speed Demodulation System for Fiber Bragg Grating Sensor Arrays Using Dispersion Fourier Transform Technology[J]. Laser & Optoelectronics Progress, 2025, 62(5): 0506004 Copy Citation Text show less
    Schematic diagram of a typical DFT-based FBG demodulation system
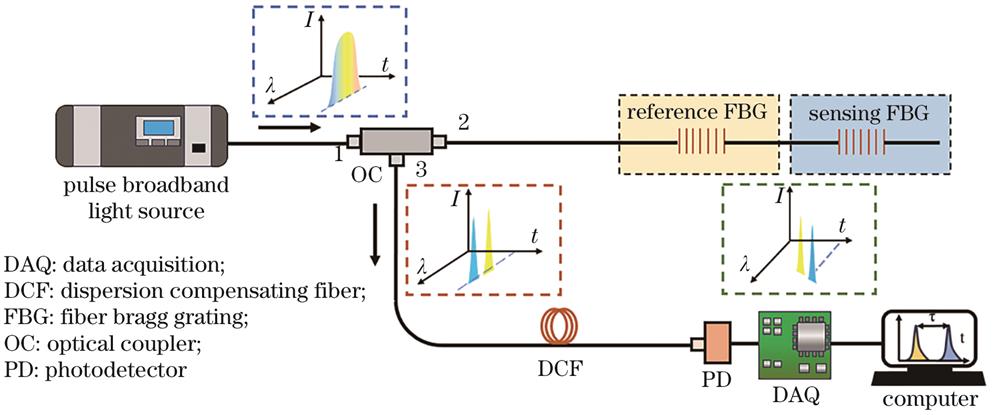
    Fig. 1. Schematic diagram of a typical DFT-based FBG demodulation system
    Experimental setup. (a) Source laser; (b) nonlinear amplifier; (c) sensing system
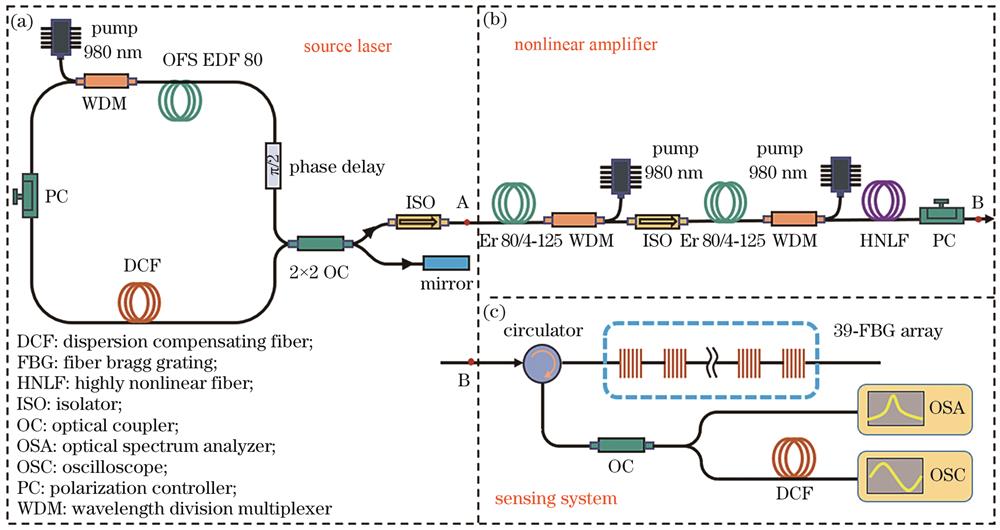
    Fig. 2. Experimental setup. (a) Source laser; (b) nonlinear amplifier; (c) sensing system
    Characteristics of the incident optical pulses. (a) Time-domain waveform of the mode-locked pulses from figure-9 fiber laser; (b) RF spectrum of the mode-locked pulses from figure-9 fiber laser with a scan range of 1 MHz and a resolution bandwidth of 1 kHz, the scanning range of the illustration is 1.0 GHz, with a resolution bandwidth of 10 kHz ; (c) optical spectrum, with the blue solid line representing the source laser spectrum and the red dashed line representing the spectrum after nonlinear amplification; (d) autocorrelation waveform after nonlinear amplification
    Fig. 3. Characteristics of the incident optical pulses. (a) Time-domain waveform of the mode-locked pulses from figure-9 fiber laser; (b) RF spectrum of the mode-locked pulses from figure-9 fiber laser with a scan range of 1 MHz and a resolution bandwidth of 1 kHz, the scanning range of the illustration is 1.0 GHz, with a resolution bandwidth of 10 kHz ; (c) optical spectrum, with the blue solid line representing the source laser spectrum and the red dashed line representing the spectrum after nonlinear amplification; (d) autocorrelation waveform after nonlinear amplification
    Reflected signal from the FBG array. (a) Reflection spectrum; (b) reflected pulse sequence; (c) reflected pulse sequence before and after DFT; (d) zoomed-in view of the reflected pulse sequence before and after DFT
    Fig. 4. Reflected signal from the FBG array. (a) Reflection spectrum; (b) reflected pulse sequence; (c) reflected pulse sequence before and after DFT; (d) zoomed-in view of the reflected pulse sequence before and after DFT
    Temperature-to-center wavelength calibration results for FBG 1 to FBG 5
    Fig. 5. Temperature-to-center wavelength calibration results for FBG 1 to FBG 5
    Demodulation results of FBG 1 during heating. (a) Reflection spectrum variation; (b) zoomed-in view of the reflection spectrum variation; (c) evolution of the reflected pulse sequence; (d) zoomed-in view of the reflected pulse sequence evolution; (e) comparison of the wavelength demodulation results with the direct wavelength measurement results; (f) temperature demodulation results
    Fig. 6. Demodulation results of FBG 1 during heating. (a) Reflection spectrum variation; (b) zoomed-in view of the reflection spectrum variation; (c) evolution of the reflected pulse sequence; (d) zoomed-in view of the reflected pulse sequence evolution; (e) comparison of the wavelength demodulation results with the direct wavelength measurement results; (f) temperature demodulation results
    Zoom-in views of the spectral and time-domain waveform variations caused by heating during sensor multiplexing. (a) Reflection spectrum variation of FBG 2 and FBG 3; (b) time-domain waveform variation of FBG 2 and FBG 3; (c) reflection spectrum variation of FBG 4 and FBG 5; (d) time-domain waveform variation of FBG 4 and FBG 5
    Fig. 7. Zoom-in views of the spectral and time-domain waveform variations caused by heating during sensor multiplexing. (a) Reflection spectrum variation of FBG 2 and FBG 3; (b) time-domain waveform variation of FBG 2 and FBG 3; (c) reflection spectrum variation of FBG 4 and FBG 5; (d) time-domain waveform variation of FBG 4 and FBG 5
    Comparison between the wavelength demodulation results and the direct wavelength measurement results during sensor multiplexing. (a) FBG 2 and FBG 3; (b) FBG 4 and FBG 5
    Fig. 8. Comparison between the wavelength demodulation results and the direct wavelength measurement results during sensor multiplexing. (a) FBG 2 and FBG 3; (b) FBG 4 and FBG 5
    Temperature demodulation results during sensor multiplexing
    Fig. 9. Temperature demodulation results during sensor multiplexing
    SensorMaximum error /℃Root mean square error /℃Pearson correlation coefficientP-value
    FBG 15.852.310.99891.0787×10-26
    FBG 24.992.200.99933.8217×10-27
    FBG 34.582.340.99978.7036×10-31
    FBG 43.651.870.99831.3812×10-23
    FBG 52.211.130.99937.0156×10-26
    Table 1. Error and correlation analysis of the temperature demodulation results
    Yinuo Fang, Qianqian Huang, Kaiquan Yan, Zishuo Xu, Mingjiao Wang, Kai Wang, Yuehui Ma, Weixi Li, Yunqi Liu, Chengbo Mou. High-Capacity, High-Speed Demodulation System for Fiber Bragg Grating Sensor Arrays Using Dispersion Fourier Transform Technology[J]. Laser & Optoelectronics Progress, 2025, 62(5): 0506004
    Download Citation