• Laser & Optoelectronics Progress
  • Vol. 59, Issue 23, 2317001 (2022)
Yiqian Guo1, Hongyan Wang2, Miao Qin2, Yida Zeng1,*..., Li Xia3 and Yangpo Hu3|Show fewer author(s)
Author Affiliations
  • 1School of Aeronautical Manufacturing Engineering, Nanchang Hangkong University, Nanchang 330063, Jiangxi, China
  • 2School of Chemistry & Chemical Engineering, Suzhou University, Suzhou 234099, Anhui, China
  • 3Jiangxi Hongdu Aviation Industry Co., Ltd., Nanchang 330024, Jiangxi, China
  • show less
    DOI: 10.3788/LOP202259.2317001 Cite this Article Set citation alerts
    Yiqian Guo, Hongyan Wang, Miao Qin, Yida Zeng, Li Xia, Yangpo Hu. Effect of Nano-Film Substrates on Ciprofloxacin Detection by Surface-Enhanced Raman Spectroscopy[J]. Laser & Optoelectronics Progress, 2022, 59(23): 2317001 Copy Citation Text show less
    Schematic diagram of assembly process of gold nano-colloid enhanced substrate. (a) 5 µL of gold nano-colloids are dropped onto silicon wafer as substrate; (b) volume of gold colloids decrease during natural drying; (c) gold colloids are dried completely to form golden films on silicon wafers
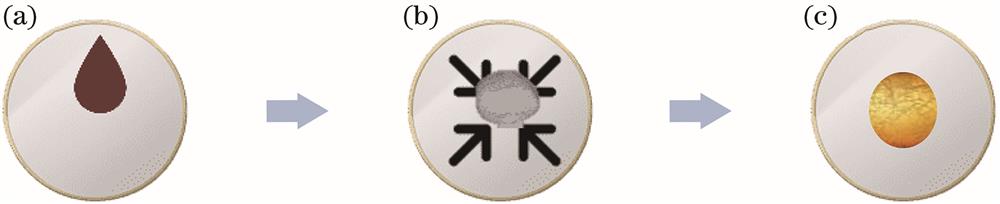
    Fig. 1. Schematic diagram of assembly process of gold nano-colloid enhanced substrate. (a) 5 µL of gold nano-colloids are dropped onto silicon wafer as substrate; (b) volume of gold colloids decrease during natural drying; (c) gold colloids are dried completely to form golden films on silicon wafers
    SERS pretreatment. (a) Original SERS; (b) LabSpec software operation interface; (c) SERS after pretreatment
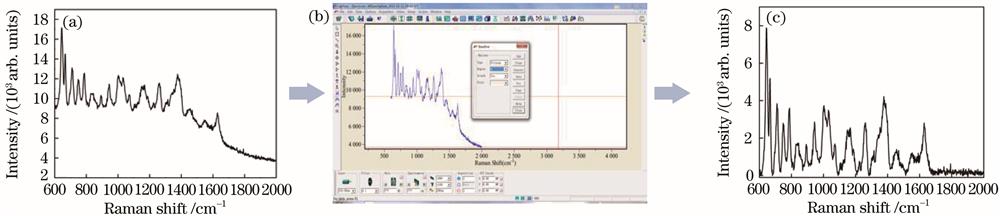
    Fig. 2. SERS pretreatment. (a) Original SERS; (b) LabSpec software operation interface; (c) SERS after pretreatment
    UV-vis spectra of self-made gold colloids. (a) Au NPs; (b) Au NRs
    Fig. 3. UV-vis spectra of self-made gold colloids. (a) Au NPs; (b) Au NRs
    SEM morphology of gold nanoparticles. (a) Au NPs and particle size distribution; (b) Au NRs
    Fig. 4. SEM morphology of gold nanoparticles. (a) Au NPs and particle size distribution; (b) Au NRs
    Normal Raman spectra (NRS) of CIP
    Fig. 5. Normal Raman spectra (NRS) of CIP
    SERS of CIP based on different laser wavelengths
    Fig. 6. SERS of CIP based on different laser wavelengths
    NRS, SERS based on Au NPs substrate of CIP aqueous solution and Raman spectra of Au NPs substrate
    Fig. 7. NRS, SERS based on Au NPs substrate of CIP aqueous solution and Raman spectra of Au NPs substrate
    SERS based on Au NRs substrate of CIP aqueous solution and Raman spectra of Au NRs substrate substrate
    Fig. 8. SERS based on Au NRs substrate of CIP aqueous solution and Raman spectra of Au NRs substrate substrate
    Stability research atlas. (a) Au NPs substrate; (b) Au NRs substrate
    Fig. 9. Stability research atlas. (a) Au NPs substrate; (b) Au NRs substrate
    SERS of chicken extracts containing 2.0×10⁻⁶ CIP detected based on different enhanced substrates
    Fig. 10. SERS of chicken extracts containing 2.0×10⁻⁶ CIP detected based on different enhanced substrates
    SERS images of different concentrations of CIP solution detected based on Au NPs substrate
    Fig. 11. SERS images of different concentrations of CIP solution detected based on Au NPs substrate
    Working curves of CIP solutions with different concentrations detected based on Au NPs substrate. (a) 1167 cm-1; (b) 1378 cm-1
    Fig. 12. Working curves of CIP solutions with different concentrations detected based on Au NPs substrate. (a) 1167 cm-1; (b) 1378 cm-1
    SERS images of different concentrations of CIP solution detected based on Au NRs substrate
    Fig. 13. SERS images of different concentrations of CIP solution detected based on Au NRs substrate
    Working curves of CIP solutions with different concentrations detected based on Au NRs substrate. (a) 1142 cm-1;(b) 1269 cm-1; (c) 1389 cm-1
    Fig. 14. Working curves of CIP solutions with different concentrations detected based on Au NRs substrate. (a) 1142 cm-1;(b) 1269 cm-1; (c) 1389 cm-1
    NRS /cm-1SERS based on Au NPs /cm-1SERS based on Au NRs /cm-1Attribution of characteristic peaks
    709709707γ(C―C)ring + γ(C=O)ring
    790786782γ(C―N)ring + γ(C―H)ring
    102610321039δ(C―N)ring + δ(C―C)ring + δ(CH2rock
    1136-1142v(C=O)ring
    11721167-δ(CH2twist
    126712611269ring breathing
    138413781389vas(C―C)benzene + v(C―H)rock
    16201630-v(C=O)ring + v(C=C)ring
    Table 1. Main peak attribution of NRS, SERS based on Au NPs substrate and Au NRs substrate of CIP
    Raman shift /cm-10.1×10-60.5×10-61×10-65×10-610×10-6Standard curveCoefficient of determination(R2Root mean squared error(RMSE)
    116747383994715902753y = 210.48x + 621.610.9806111.6517
    13786531028111928114289y = 362.28x + 777.240.9902136.2291
    Table 2. Standard curves of CIP standard solution under different Raman displacements measured based on Au NPs substrate
    Raman shift /cm-1Working curveActual content /10-6SERS intensity /arb.unitsPredicted content /10-6Recovery rate /%
    1167y = 210.48x + 621.610.26450.1155.0
    0.77620.6795.7
    2.010772.16108.4
    1378y = 362.28x + 777.240.28510.21105.0
    0.710230.6897.1
    2.015182.04102.3
    Table 3. Recovery parameters of CIP solution detected based on Au NPs substrate
    Raman shift /cm-10.1×10-60.5×10-61×10-65×10-610×10-6Standard curveR2RMSE
    114260781091815072361y = 167.75x + 683.690.992555.15
    1269832848104418042584y = 179.9x + 825.140.993953.01
    13895856617129631175y = 57.166x + 629.410.974335.01
    Table 4. Standard curves of CIP standard solution under different Raman displacements measured based on Au NRs substrate
    Raman shift /cm-1Working curveActual content /10-6SERS intensity /arb. unitsPredicted content /10-6Recovery rate /%
    1142y = 167.75x + 683.690.27220.22111.5
    0.78080.74106.0
    2.011292.65132.5
    1269y = 179.9x + 825.140.28590.1996.3
    0.79600.75107.8
    2.012632.44121.8
    1389y = 57.166x + 629.410.26480.32161.4
    0.76871.00143.3
    2.07792.61130.4
    Table 5. Recovery parameters of CIP solution detected based on Au NRs substrate
    Yiqian Guo, Hongyan Wang, Miao Qin, Yida Zeng, Li Xia, Yangpo Hu. Effect of Nano-Film Substrates on Ciprofloxacin Detection by Surface-Enhanced Raman Spectroscopy[J]. Laser & Optoelectronics Progress, 2022, 59(23): 2317001
    Download Citation