• Laser & Optoelectronics Progress
  • Vol. 59, Issue 14, 1415015 (2022)
Wenxi Yu and Guili Xu*
Author Affiliations
  • College of Automation Engineering, Nanjing University of Aeronautics and Astronautics, Nanjing 210016, Jiangsu , China
  • show less
    DOI: 10.3788/LOP202259.1415015 Cite this Article Set citation alerts
    Wenxi Yu, Guili Xu. Connector Surface Crack Detection Method[J]. Laser & Optoelectronics Progress, 2022, 59(14): 1415015 Copy Citation Text show less
    Flow chart of the designed method
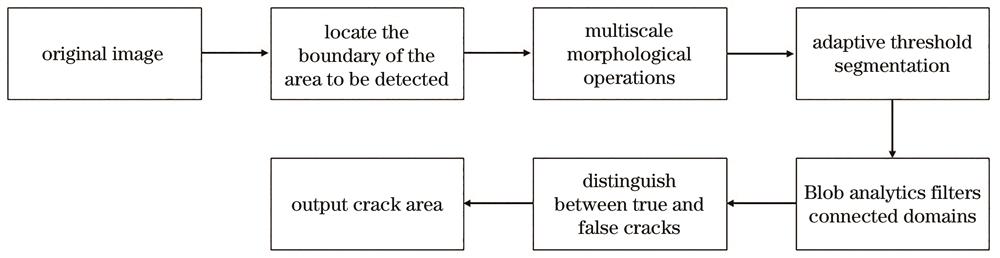
    Fig. 1. Flow chart of the designed method
    Original image
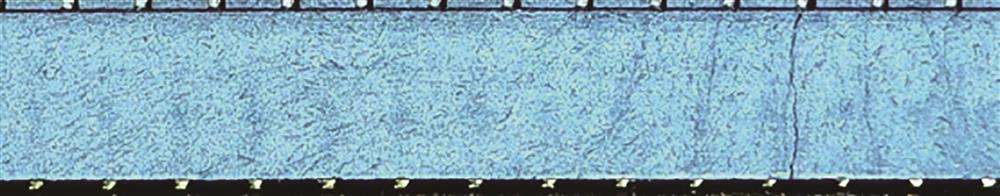
    Fig. 2. Original image
    Result of image binarization processing. (a) Image to be processed; (b) result of binarization processing
    Fig. 3. Result of image binarization processing. (a) Image to be processed; (b) result of binarization processing
    Boundary detection result. (a) Image of the area to be detected; (b) masked image of the area to be detected
    Fig. 4. Boundary detection result. (a) Image of the area to be detected; (b) masked image of the area to be detected
    12 structural elements constructed in this paper
    Fig. 5. 12 structural elements constructed in this paper
    Comparison of extraction effect between the proposed method and black hat operation. (a) Black hat operation; (b) proposed method
    Fig. 6. Comparison of extraction effect between the proposed method and black hat operation. (a) Black hat operation; (b) proposed method
    Columnwise projection result
    Fig. 7. Columnwise projection result
    Image segmentation result
    Fig. 8. Image segmentation result
    Schematic of location features
    Fig. 9. Schematic of location features
    Schematic of spindle direction
    Fig. 10. Schematic of spindle direction
    Schematic of the equivalent ellipse of the cracked area
    Fig. 11. Schematic of the equivalent ellipse of the cracked area
    Detection result of Blob analysis
    Fig. 12. Detection result of Blob analysis
    Some pseudo cracks and detection results. (a) Pseudo-crack original images; (b) test results
    Fig. 13. Some pseudo cracks and detection results. (a) Pseudo-crack original images; (b) test results
    Physical picture of crack detection system
    Fig. 14. Physical picture of crack detection system
    Detection result comparison of different methods
    Fig. 15. Detection result comparison of different methods
    MethodTotal number of samplesCorrectly identified number of samplesNumber of false detectionsNumber of missed testsFalse detection rate /%Accuracy /%
    Method in Ref.[520861848236211.488.6
    Method in Ref.[102086197710725.294.8
    Proposed method208620255832.997.1
    Table 1. Detection results