• Journal of Atmospheric and Environmental Optics
  • Vol. 20, Issue 1, 47 (2025)
YANG Kunpeng1,*, LIU Haoran1,2, XING Chengzhi3, SU Wenjing4..., HONG Qianqian5, LI Qihua1, JI Xiangguang2 and LIU Cheng3,6|Show fewer author(s)
Author Affiliations
  • 1Institutes of Physical Science and Information Technology, Anhui University, Hefei 230601, China
  • 2Information Materials and Intelligent Sensing Laboratory of Anhui Province, Anhui University, Hefei 230601, China
  • 3Key Laboratory of Environmental Optics and Technology, Anhui Institute of Optics and Fine Mechanics, HFIPS, Chinese Academy of Sciences, Hefei 230031, China
  • 4Department of Environmental Science and Engineering, University of Science and Technology of China, Hefei 230026, China
  • 5School of Atmosphere and Remote Sensing, Wuxi University, Wuxi 214105, China
  • 6Department of Precision Machinery and Precision Instrumentation, University of Science and Technology of China, Hefei 230026, China
  • show less
    DOI: 10.3969/j.issn.1673-6141.2025.01.004 Cite this Article
    Kunpeng YANG, Haoran LIU, Chengzhi XING, Wenjing SU, Qianqian HONG, Qihua LI, Xiangguang JI, Cheng LIU. Analysis of tropospheric ozone characterization in Pearl River Delta region based on TROPOMI[J]. Journal of Atmospheric and Environmental Optics, 2025, 20(1): 47 Copy Citation Text show less
    Correlation analysis of tropospheric VCD measured by TROPOMI and Shenzhen MAX-DOAS station. (a) NO2; (b) HCHO
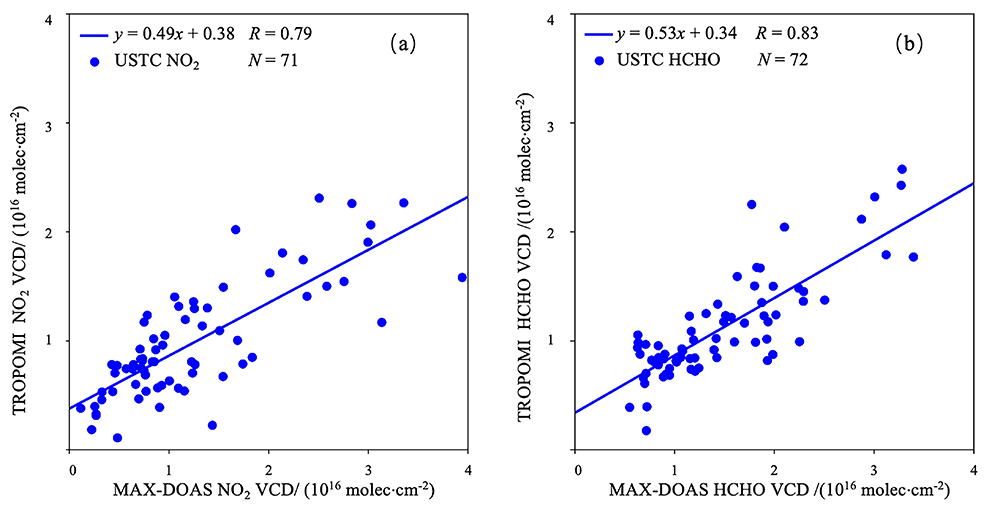
    Fig. 1. Correlation analysis of tropospheric VCD measured by TROPOMI and Shenzhen MAX-DOAS station. (a) NO2; (b) HCHO
    The average VCD distribution of tropospheric NO2 (a) and HCHO (b) in PRD from September 2019 to February 2020
    Fig. 2. The average VCD distribution of tropospheric NO2 (a) and HCHO (b) in PRD from September 2019 to February 2020
    The average tropospheric VCD variation of NO2 (a) and HCHO (b) in PRD from September 2019 to February 2020
    Fig. 3. The average tropospheric VCD variation of NO2 (a) and HCHO (b) in PRD from September 2019 to February 2020
    The monthly relative changes of industrial NOx emissions (relative to September 2019) in PRD from September 2019 to February 2020
    Fig. 4. The monthly relative changes of industrial NOx emissions (relative to September 2019) in PRD from September 2019 to February 2020
    The average VCD distribution of tropospheric O3 in PRD from September 2019 to February 2020
    Fig. 5. The average VCD distribution of tropospheric O3 in PRD from September 2019 to February 2020
    The average tropospheric VCD variation of O3 in PRD from September 2019 to February 2020
    Fig. 6. The average tropospheric VCD variation of O3 in PRD from September 2019 to February 2020
    The averaged ozone formation sensitivity regime in autumn (September 2019 to November 2019) (a) and winter (December 2019 to February 2020) (b) time of the PRD region
    Fig. 7. The averaged ozone formation sensitivity regime in autumn (September 2019 to November 2019) (a) and winter (December 2019 to February 2020) (b) time of the PRD region
    The averaged ozone formation sensitivity regime in urban (a) and rural (b) areas of the PRD region from September 2019 to February 2020
    Fig. 8. The averaged ozone formation sensitivity regime in urban (a) and rural (b) areas of the PRD region from September 2019 to February 2020
    RegimeThresholdsHCHO VCD with O3 VCDNO2 VCD with O3 VCD
    SlopeR2SlopeR2
    VOCs-limited< 1.028.630.843.560.31
    Transition1.0–2.03.600.144.290.15
    NOx-limited> 2.04.090.1210.810.30
    Table 1. Ozone formation sensitivity regimes' thresholds and VCD correlation analysis of HCHO,NO2 with O3
    TimeUrban areasRural areas
    NO2 VCD/ (molec·cm-2)HCHO VCD/ (molec·cm-2)O3 VCD /DUVOCs-limited regime/%Transition regime/%NOx-limited regime /%NO2 VCD/ (molec·cm-2)HCHO VCD/ (molec·cm-2)O3 VCD/DUVOCs-limited regime /%Transition regime/%NOx-limited regime /%
    2019-097.49 × 10151.62 × 101638.230.1131.0268.863.37 × 10151.22 × 101636.430.021.6698.31
    2019-108.36 × 10151.70 × 101645.940.7039.4559.853.73 × 10151.15 × 101644.030.143.6396.23
    2019-111.35 × 10161.42 × 101638.8237.2352.969.814.62 × 10151.01 × 101637.042.9719.9577.07
    2019-121.79 × 10169.12 × 101536.6577.8017.095.124.84 × 10157.59 × 101535.8313.6221.8064.58
    2020-019.59 × 10159.47 × 101538.7145.8142.5911.603.16 × 10157.76 × 101538.702.9017.4579.66
    2020-025.31 × 10159.34 × 101543.781.3455.9642.702.25 × 10157.88 × 101544.010.155.9293.94
    Table 2. The VCD of ozone and its precursor and proportion of each ozone formation sensitivity regime in urban and rural areas in PRD by month
    Kunpeng YANG, Haoran LIU, Chengzhi XING, Wenjing SU, Qianqian HONG, Qihua LI, Xiangguang JI, Cheng LIU. Analysis of tropospheric ozone characterization in Pearl River Delta region based on TROPOMI[J]. Journal of Atmospheric and Environmental Optics, 2025, 20(1): 47
    Download Citation