• Laser & Optoelectronics Progress
  • Vol. 60, Issue 2, 0230002 (2023)
Yuhao Li1,2, Yi Yu1,*, Zhiyuan Sun1, and Yuanchao Mu1,2
Author Affiliations
  • 1Fine Instrument and Equipment Research & Development Center, Changchun Institute of Optics, Fine Mechanics and Physics, Chinese Academy of Sciences, Changchun 130033, Jilin, China
  • 2University of Chinese Academy of Sciences, Beijing 100049, China
  • show less
    DOI: 10.3788/LOP220491 Cite this Article Set citation alerts
    Yuhao Li, Yi Yu, Zhiyuan Sun, Yuanchao Mu. Smartphone-Based Snapshot Fluorescence Multispectral Imaging[J]. Laser & Optoelectronics Progress, 2023, 60(2): 0230002 Copy Citation Text show less
    Fluorescent color card
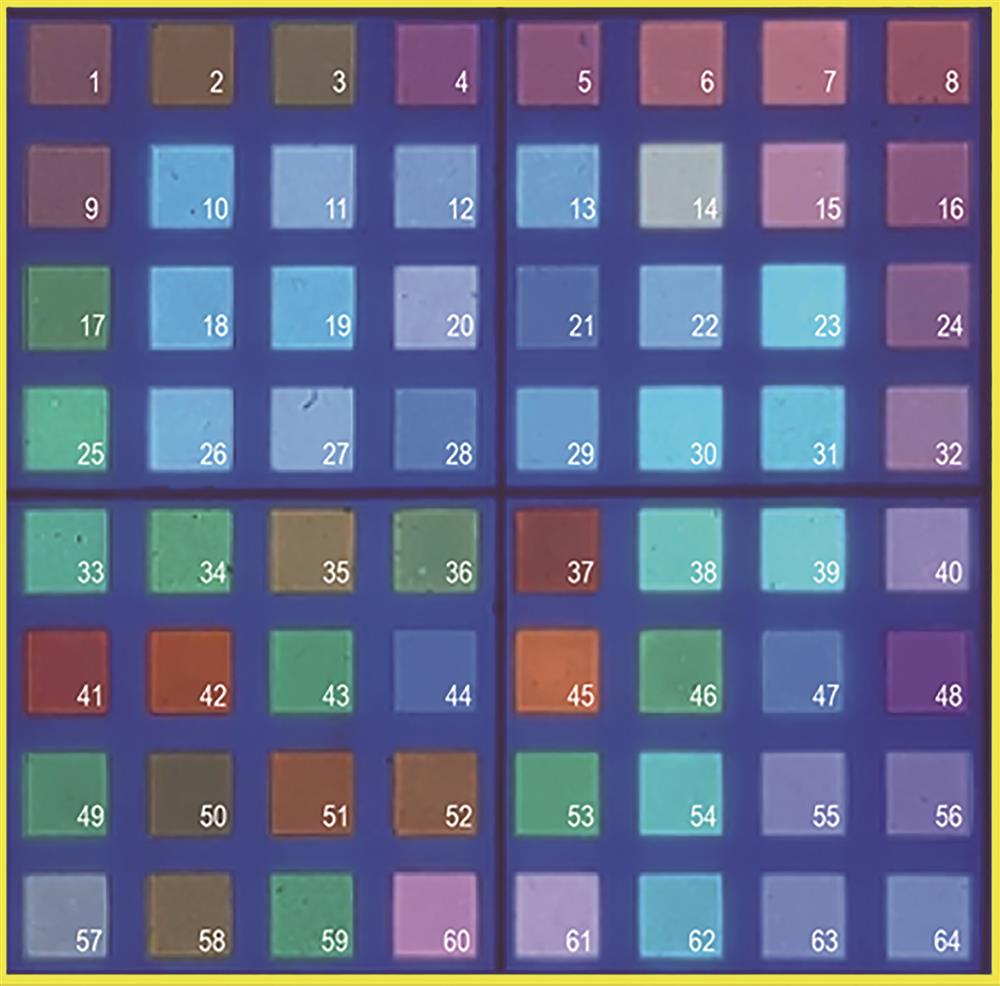
    Fig. 1. Fluorescent color card
    Spectral intensity curves of 64 color blocks
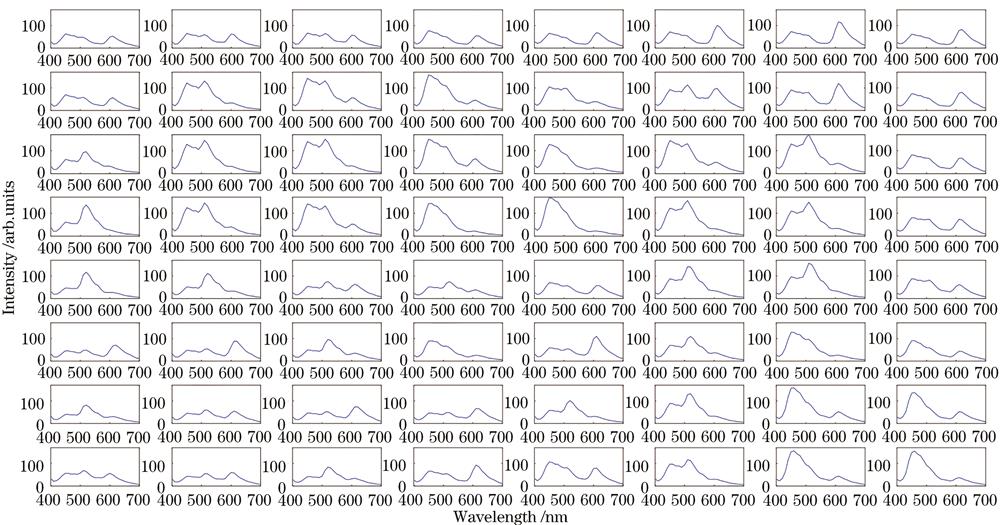
    Fig. 2. Spectral intensity curves of 64 color blocks
    Smart phone and a homemade phone case (case with battery pack and fluorescent lamp)
    Fig. 3. Smart phone and a homemade phone case (case with battery pack and fluorescent lamp)
    Comparison of initial and reconstructed fluorescence spectra of three representative fluorescent color patches in 31 bands. (a) Correlation coefficient is 0.9996 (maximum value); (b) correlation coefficient is 0.9384 (minimum value); (c) correlation coefficient is 0.9855 (close to average value)
    Fig. 4. Comparison of initial and reconstructed fluorescence spectra of three representative fluorescent color patches in 31 bands. (a) Correlation coefficient is 0.9996 (maximum value); (b) correlation coefficient is 0.9384 (minimum value); (c) correlation coefficient is 0.9855 (close to average value)
    RGB mode autofluorescence images of the skin and oral cavity
    Fig. 5. RGB mode autofluorescence images of the skin and oral cavity
    Reconstruction of multispectral autofluorescence data cube
    Fig. 6. Reconstruction of multispectral autofluorescence data cube
    Spectral analysis and bacteria-targeted feature mapping
    Fig. 7. Spectral analysis and bacteria-targeted feature mapping
    Quantitative analysis of porphyrin and background autofluorescence produced by bacteria
    Fig. 8. Quantitative analysis of porphyrin and background autofluorescence produced by bacteria

    0.9771

    0.9825

    0.9615

    0.9897

    0.9939

    0.9725

    0.9887

    0.9394

    0.9649

    0.9990

    0.9987

    0.9947

    0.9961

    0.9928

    0.9459

    0.9384

    0.9808

    0.9976

    0.9996

    0.9992

    0.9457

    0.9925

    0.9853

    0.9861

    0.9960

    0.9973

    0.9982

    0.9986

    0.9843

    0.9853

    0.9852

    0.9673

    0.9909

    0.9930

    0.9974

    0.9517

    0.9406

    0.9813

    0.9928

    0.9905

    0.9938

    0.9756

    0.9987

    0.9968

    0.9990

    0.9855

    0.9954

    0.9989

    0.9947

    0.9994

    0.9910

    0.9949

    0.9871

    0.9945

    0.9951

    0.9977

    0.9738

    0.9892

    0.9873

    0.9796

    0.9845

    0.9984

    0.9960

    0.9949

    Table 1. Correlation coefficient between initial and reconstructed fluorescence spectra of 64 color blocks

    0.0373

    0.0448

    0.0876

    0.0560

    0.0352

    0.0414

    0.0593

    0.1263

    0.0552

    0.0226

    0.0459

    0.0459

    0.0250

    0.0251

    0.0676

    0.0294

    0.0514

    0.0354

    0.0349

    0.0211

    0.0574

    0.0436

    0.0304

    0.0836

    0.0384

    0.0555

    0.0380

    0.0759

    0.0574

    0.1514

    0.0403

    0.1240

    0.0440

    0.1266

    0.0306

    0.1822

    0.0847

    0.0705

    0.0382

    0.1253

    0.0506

    0.0718

    0.0338

    0.0396

    0.0426

    0.0327

    0.0388

    0.0518

    0.0755

    0.0876

    0.0850

    0.0478

    0.0729

    0.0547

    0.0814

    0.0525

    0.0480

    0.0356

    0.0469

    0.0451

    0.0589

    0.0231

    0.0453

    0.0524

    Table 2. Root mean square error between initial and reconstructed fluorescence spectra of 64 color blocks