• Laser & Optoelectronics Progress
  • Vol. 60, Issue 15, 1506005 (2023)
Shaoye Wang1,2,3, Jianbo Zhang1,2,3, Ziwen Zhao1,2,3,*, Yifan Du1,2,3, and Shuangqi Zhong1,2,3
Author Affiliations
  • 1Key Laboratory of Specialty Fiber Optics and Optical Access Networks, Shanghai University, Shanghai 200444, China
  • 2Joint International Research Laboratory of Specialty Fiber Optics and Advanced; Communication, Shanghai University, Shanghai 200444, China
  • 3Shanghai Institute for Advanced Communication and Data Science, Shanghai University, Shanghai 200444, China
  • show less
    DOI: 10.3788/LOP221828 Cite this Article Set citation alerts
    Shaoye Wang, Jianbo Zhang, Ziwen Zhao, Yifan Du, Shuangqi Zhong. COMSOL Simulation of Temperature Field of CO2 Laser Annealing Ge Core Fiber[J]. Laser & Optoelectronics Progress, 2023, 60(15): 1506005 Copy Citation Text show less
    Annealing device. (a) CO2 laser device diagram; (b) laser beam
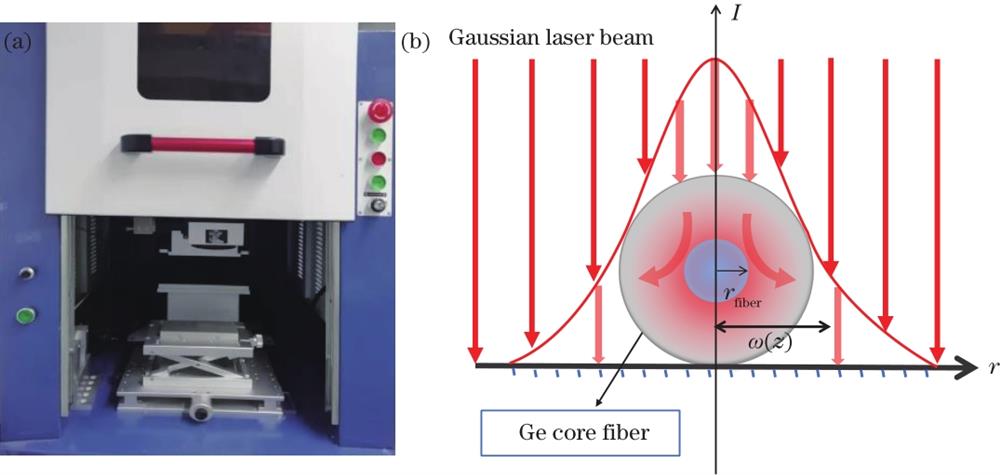
    Fig. 1. Annealing device. (a) CO2 laser device diagram; (b) laser beam
    Schematic diagram of laser annealing Ge core fiber
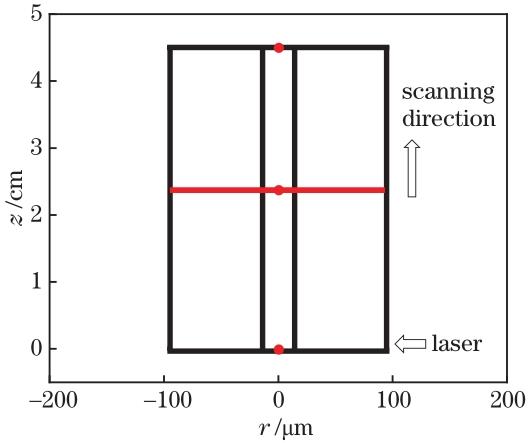
    Fig. 2. Schematic diagram of laser annealing Ge core fiber
    Ge core fiber. (a) Cross-section of Ge core fiber; (b) side view of Ge core fiber
    Fig. 3. Ge core fiber. (a) Cross-section of Ge core fiber; (b) side view of Ge core fiber
    Temperature change curve of axial center point. (a) v = 6 mm/s; (b) v = 9 mm/s; (c) v = 12 mm/s; (d) v = 15 mm/s; (e) v = 18 mm/s; (f) v = 21 mm/s
    Fig. 4. Temperature change curve of axial center point. (a) v = 6 mm/s; (b) v = 9 mm/s; (c) v = 12 mm/s; (d) v = 15 mm/s; (e) v = 18 mm/s; (f) v = 21 mm/s
    Radial temperature field distribution of the Ge core fiber at z = 2.25 cm
    Fig. 5. Radial temperature field distribution of the Ge core fiber at z = 2.25 cm
    Temperature field distribution at the center point of the two ends of the fiber axis. (a) v = 15 mm/s, P = 4.305 W; (b) v = 18 mm/s, P =5.381 W
    Fig. 6. Temperature field distribution at the center point of the two ends of the fiber axis. (a) v = 15 mm/s, P = 4.305 W; (b) v = 18 mm/s, P =5.381 W
    Fitting diagram of fiber axial and radial temperature difference
    Fig. 7. Fitting diagram of fiber axial and radial temperature difference
    Raman spectrum. (a) Comparison of Raman peak frequency; (b) line chart of Raman peak
    Fig. 8. Raman spectrum. (a) Comparison of Raman peak frequency; (b) line chart of Raman peak
    v /(mm·s-1Maximum temperature /K
    P =1.076 WP =2.153 WP =3.229 WP =4.305 WP =5.381 W
    68621204142015721696
    97301002125314561617
    12638915114413441513
    15575819101612041381
    1853074794811311290
    2149868487010361193
    Table 1. Statistics of the maximum temperature at the center point
    v /(mm·s-1691215181821
    P /W2.1533.2293.2294.3054.3055.3815.381
    Tdiff /K24503750172121
    Table 2. Radial temperature difference at different annealing conditions
    v /(mm·s-1691215181821
    P /W2.1533.2293.2294.3054.3055.3815.381
    Tz0 /K99510689469909101022949
    Tz4.5 /K1433151413921391137615691435
    Tdiff /K438446446401466547486
    Table 3. Statistics of maximum temperature at the center point of both ends of the fiber axis
    v/(mm·s-1691215181821
    P /W2.1533.2293.2294.3054.3055.3815.381
    Tdiff* in radial /K0.2121.0000.6061.0000.0000.1210.121
    Tdiff* in axis /K0.2530.3080.3080.0000.4451.0000.582
    Table 4. Normalized axial and radial temperature difference
    Shaoye Wang, Jianbo Zhang, Ziwen Zhao, Yifan Du, Shuangqi Zhong. COMSOL Simulation of Temperature Field of CO2 Laser Annealing Ge Core Fiber[J]. Laser & Optoelectronics Progress, 2023, 60(15): 1506005
    Download Citation