
Meng Zou, He Xiao, Qingguo Song, Xiangpeng Xiao, Kai Shen, Qizhen Sun, Zhijun Yan. Review of Short Cavity Ultra-Narrow Linewidth Low Noise Fiber Laser Technology[J]. Laser & Optoelectronics Progress, 2023, 60(15): 1500002
- Laser & Optoelectronics Progress
- Vol. 60, Issue 15, 1500002 (2023)
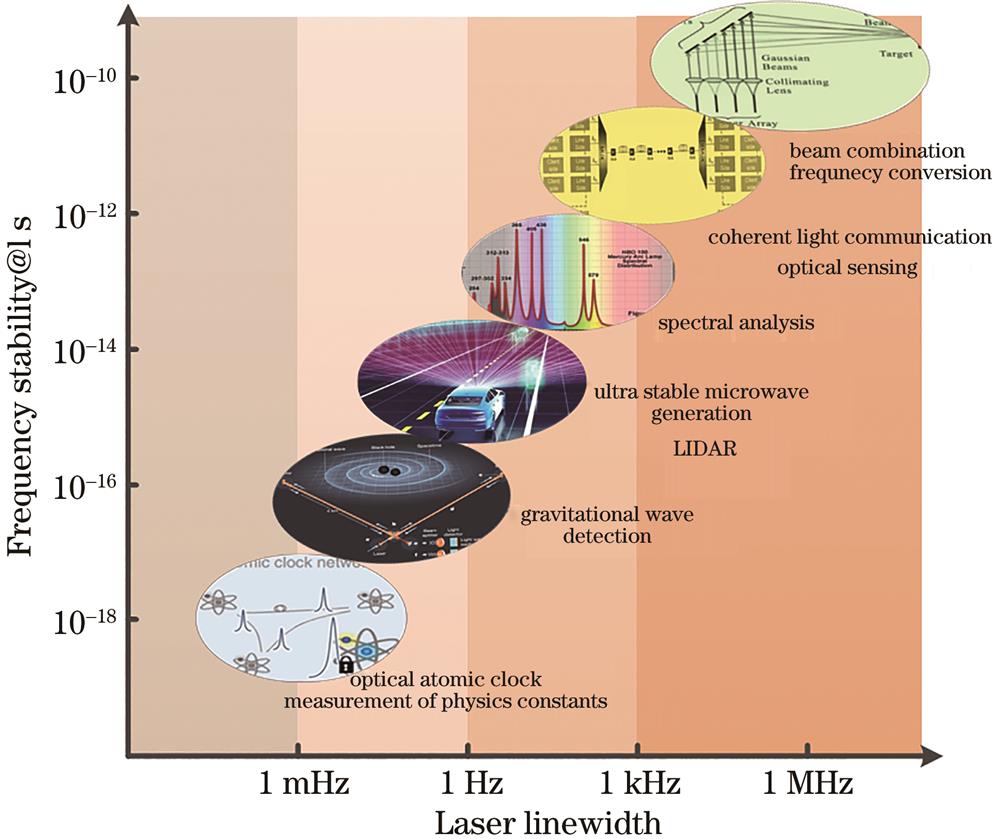
Fig. 1. Laser application field distribution with different line widths and frequency stabilities

Fig. 2. Schematic diagram of direct measurement of RIN by spectrograph
Fig. 3. Schematic diagram of laser phase noise measurement system based on optical fiber interferometer
Fig. 4. Schematic diagram of laser low frequency phase noise measurement system by beat frequency method
Fig. 5. Photoelectric feedback suppression of laser intensity noise system diagram and intensity noise and power stability test results [24]
Fig. 6. Optical path diagram of DBR fiber laser intensity noise suppression based on cascaded SOA and RIN test results [30]
Fig. 7. Optical path diagram of self-injection locking suppression laser noise and results of laser line width and RIN test with different delay fiber lengths[32]
Fig. 8. Frequency noise suppression of DBR fiber laser based on a high-Q MgF2 crystalline whispering-gallery-mode resonator injection locking and experimental results[35]
Fig. 9. Schematic diagram and RIN test results of experimental device for suppressing intensity noise of DBR fiber laser based on SOA and self-injection locking[38]
Fig. 11. Schematic diagram of PDH frequency stabilization technology system [63]
Fig. 12. Frequency stabilization system and laser frequency stability and line width test results based on high precision FP cavity fiber laser[65]
Fig. 13. Frequency stabilization system and laser frequency stability and line width test results based on ultra-stable FP cavity DBR fiber laser[66]
Fig. 14. Secondary frequency stabilized laser system based on silicon-based microring cavity and fused silicon FP cavity and the fractional test results of laser frequency noise and stability [7]
Fig. 15. Virtual ring cavity based DBR fiber laser and single-longitudinal model and RIN test results [76]
Fig. 16. Schematic diagram of ultra-stable microwave signal generated by ultra-stable light source combined with optical frequency comb and test results of phase noise of microwave signal [77]
Fig. 17. 30 cm reference FP cavity and frequency stability test results of frequency stabilized laser based on the cavity [78]
Fig. 18. Clock laser of ultra-stable laser as atomic optical clock [78]
Fig. 19. Gravitational wave detection system with laser interferometer [4]
|
Table 1. Comparision of schemes and indexes of different narrow linewidth fiber laser manufacturers
|
Table 2. Comparison of advantages and disadvantages of different reference frequency standards and frequency stability


Set citation alerts for the article
Please enter your email address

© Copyright 2018-2021 | Chinese Laser Press. All Rights Reserved 沪ICP备15018463号-20