• Laser & Optoelectronics Progress
  • Vol. 60, Issue 12, 1228006 (2023)
Yihan Chen1,**, Yian Liu1,*, and Hailing Song2
Author Affiliations
  • 1School of Artificial Intelligence and Computer Science, Jiangnan University, Wuxi 214122, Jiangsu, China
  • 2Naval Research Institute, Beijing 100161, China
  • show less
    DOI: 10.3788/LOP221062 Cite this Article Set citation alerts
    Yihan Chen, Yian Liu, Hailing Song. Separation of Radar Co-Frequency Signal Based on Improved Crow Search Algorithm[J]. Laser & Optoelectronics Progress, 2023, 60(12): 1228006 Copy Citation Text show less
    ICA principle
    Fig. 1. ICA principle
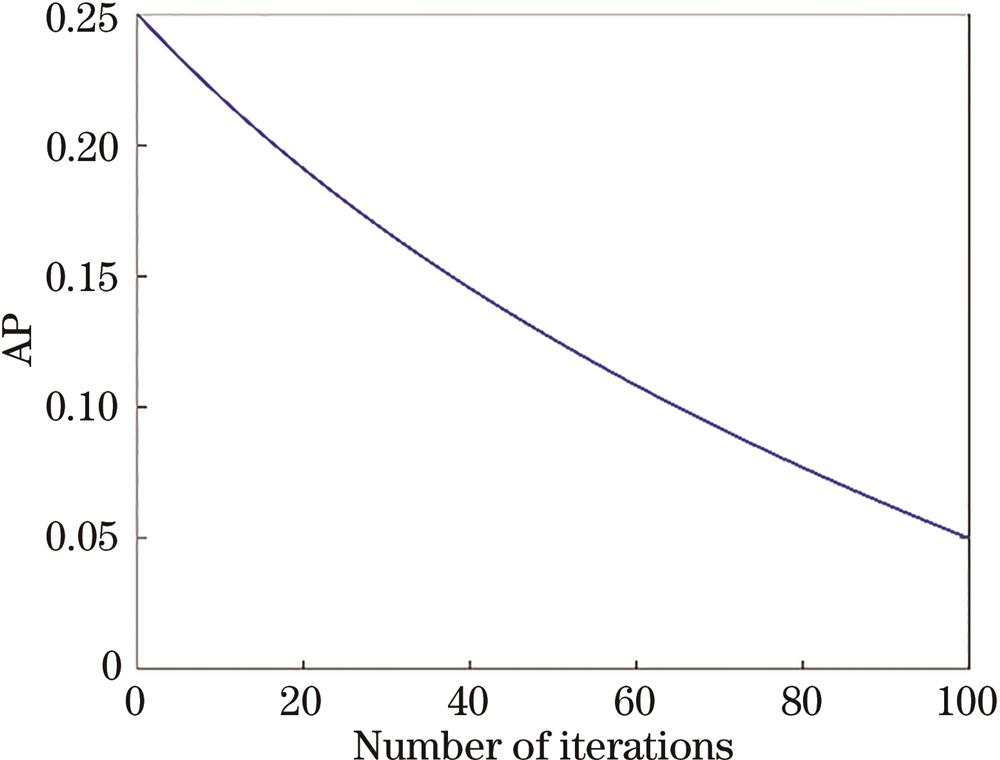
    Dynamic AP
    Fig. 2. Dynamic AP
    GSACSA-ICA flow chat
    Fig. 3. GSACSA-ICA flow chat
    Convergence curves of text function. (a) Convergence curve of f1; (b) convergence curve of f2; (c) convergence curve of f3; (d) convergence curve of f4; (e) convergence curve of f5; (f) convergence curve of f6
    Fig. 4. Convergence curves of text function. (a) Convergence curve of f1; (b) convergence curve of f2; (c) convergence curve of f3; (d) convergence curve of f4; (e) convergence curve of f5; (f) convergence curve of f6
    Radar signal waveforms. (a) Target echo signal; (b) co-frequency interference signal 1; (c) co-frequency interference signal 2
    Fig. 5. Radar signal waveforms. (a) Target echo signal; (b) co-frequency interference signal 1; (c) co-frequency interference signal 2
    Radar signal frequency spectra. (a) Target echo signal; (b) co-frequency interference signal 1; (c) co-frequency interference signal 2
    Fig. 6. Radar signal frequency spectra. (a) Target echo signal; (b) co-frequency interference signal 1; (c) co-frequency interference signal 2
    Waveform and frequency spectrum of observed signal
    Fig. 7. Waveform and frequency spectrum of observed signal
    Function fitness value change curve
    Fig. 8. Function fitness value change curve
    Signal output waveforms after separation. (a) Separate signal 1; (b separate signal 2; (c) separate signal 3
    Fig. 9. Signal output waveforms after separation. (a) Separate signal 1; (b separate signal 2; (c) separate signal 3
    Signal output frequency spectra after separation. (a) Separate signal 1; (b) separate signal 2; (c) separate signal 3
    Fig. 10. Signal output frequency spectra after separation. (a) Separate signal 1; (b) separate signal 2; (c) separate signal 3
    Signal matching filtering effect
    Fig. 11. Signal matching filtering effect
    Function nameFunction expressionDimensionSearch spaceOptimal value
    Spheref1x=i=1nxi230-100,1000
    Schwefel 2.22f2x=i=1nxi+i=1nxi30-10,100
    Quarticf3x=i=1nixi4+random0,130-1.28,1.280
    Ackleyf4x=-20exp-0.21ni=1nxi2-exp1ni=1ncos2πxi+20+e30-32,320
    Rastriginf5x=i=1nxi2-10cos2πxi+1030-5.12,5.120
    Griewankf6x=14000i=1nxi-i=1ncosxii+130-600,6000
    Table 1. Benchmark test function
    FunctionAlgorithmOptimal valueWorst valueAverage valueStandard deviation
    f1PSO1.0252×1032.8385×1032.0986×103735.8144
    Gold-SA9.2358×10-3043.1718×10-2153.1718×10-2140
    CSA2.1247×10-70.01120.00230.0041
    ICSA5.4221×10-702.9862×10-412.9864×10-429.4430×10-42
    GSACSA0000
    f2PSO18.038331.199524.62224.4906
    Gold-SA8.7327×10-1502.0531×10-1141.0522×10-1134.3283×10-114
    CSA0.00140.03830.01700.0149
    ICSA7.0486×10-342.2356×10-242.5050×10-256.9985×10⁻²⁵
    GSACSA2.0984×10-2803.8382×10-2113.8382×10-2120
    f3PSO0.30811.96050.79140.5318
    Gold-SA1.5730×10-40.00160.00480.0017
    CSA9.3007×10-50.00229.4556×10-46.5185×10⁻⁴
    ICSA6.5843×10-57.4332×10-43.0638×10-42.3329×10⁻⁴
    GSACSA7.6225×10-64.9216×10-41.9099×10-41.4093×10⁻⁴
    f4PSO10.203714.208712.13941.2326
    Gold-SA8.8818×10-161.5987×10-154.4409×10-151.4980×10⁻¹⁵
    CSA1.8075×10-50.02390.00970.0087
    ICSA8.8818×10-164.4409×10-151.2434×10-151.1235×10⁻¹⁵
    GSACSA8.8818×10-168.8818×10-168.8818×10-160
    f5PSO104.4275164.2278132.366719.0805
    Gold-SA0000
    CSA6.2361×10-70.00630.00170.0023
    ICSA0000
    GSACSA0000
    f6PSO18.661442.105728.47016.4986
    Gold-SA0000
    CSA8.6892×10-80.12900.02170.0405
    ICSA0000
    GSACSA0000
    Table 2. Simulation results of different algorithms for six functions
    MethodSeparation degreePerformance indexNumber of iterations
    FastICA0.93270.123853
    IPSO-ICA0.95190.087534
    IWOA-ICA0.95560.082229
    CSA-ICA0.94820.096137
    GSACSA-ICA0.96280.074822
    Table 3. Separation degree and performance index of signals separated by each method
    Yihan Chen, Yian Liu, Hailing Song. Separation of Radar Co-Frequency Signal Based on Improved Crow Search Algorithm[J]. Laser & Optoelectronics Progress, 2023, 60(12): 1228006
    Download Citation