• Laser & Optoelectronics Progress
  • Vol. 56, Issue 11, 110101 (2019)
Xiaoping Su, Deyong Sun*, Shengqiang Wang, Zhongfeng Qiu, and Yu Huan
Author Affiliations
  • School of Marine Sciences, Nanjing University of Information Science & Technology, Nanjing, Jiangsu 210044, China
  • show less
    DOI: 10.3788/LOP56.110101 Cite this Article Set citation alerts
    Xiaoping Su, Deyong Sun, Shengqiang Wang, Zhongfeng Qiu, Yu Huan. Remote Sensing to Estimate Sea-Surface Density of Yellow and Bohai Seas off the East Coast of China[J]. Laser & Optoelectronics Progress, 2019, 56(11): 110101 Copy Citation Text show less
    Distribution of SSD site number (black curve is normal distribution)
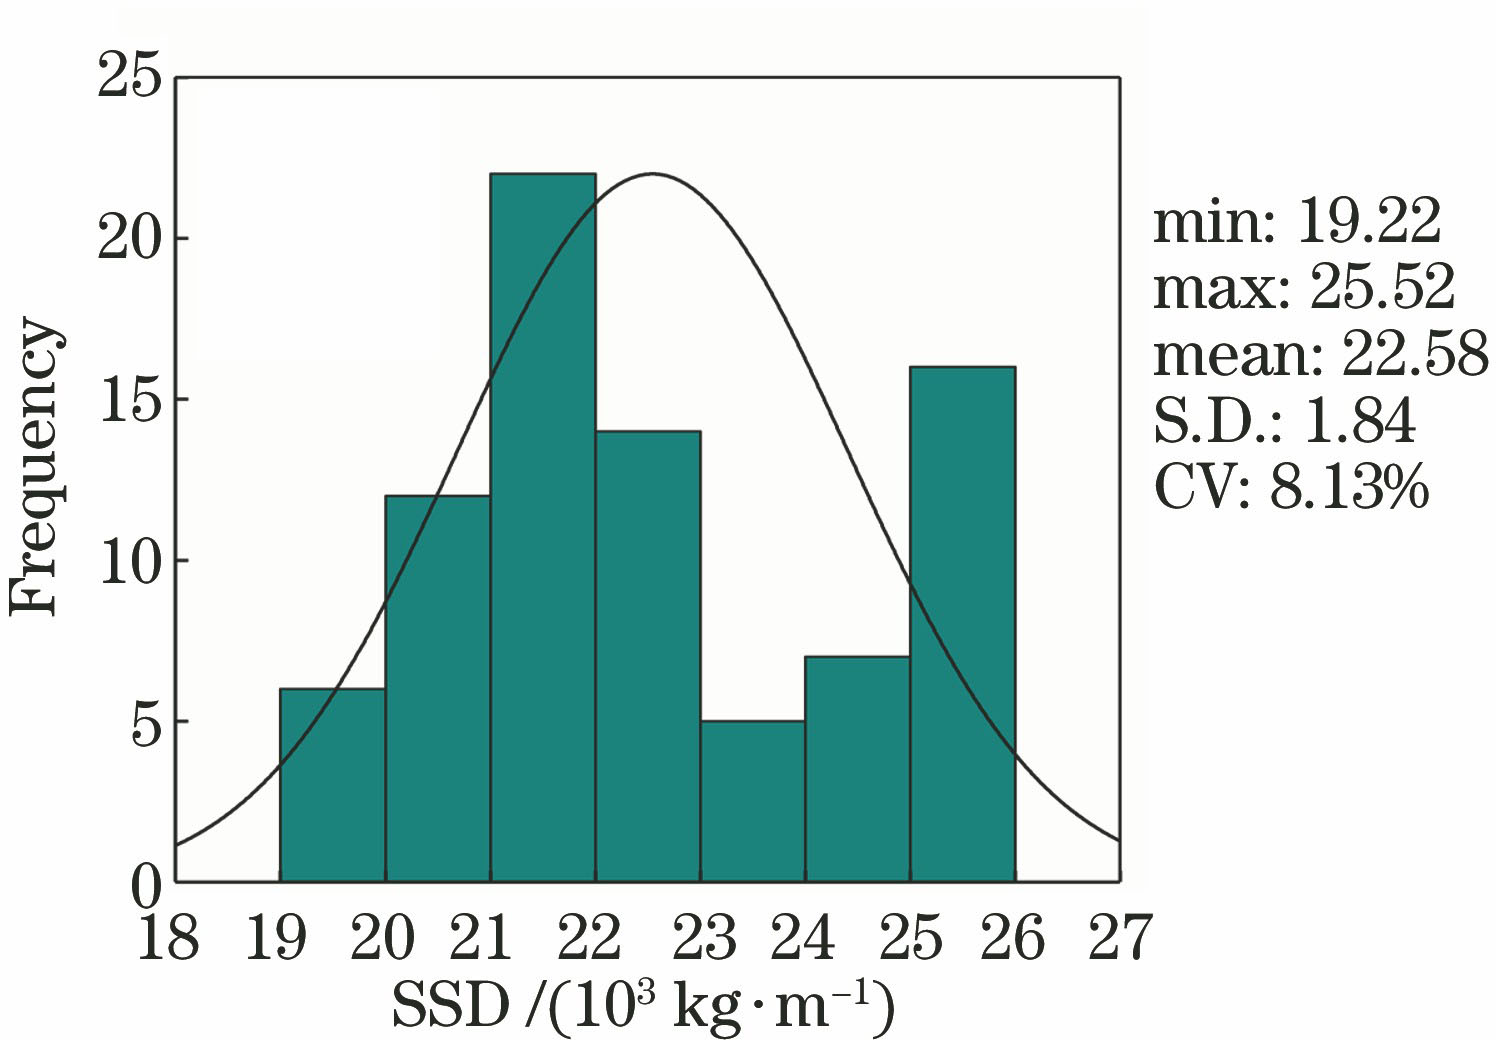
    Fig. 1. Distribution of SSD site number (black curve is normal distribution)
    Correlation between single band, band ratio remote sensing reflectivity and SSD. (a) Rrs in single band; (b) Rrs in band ratio
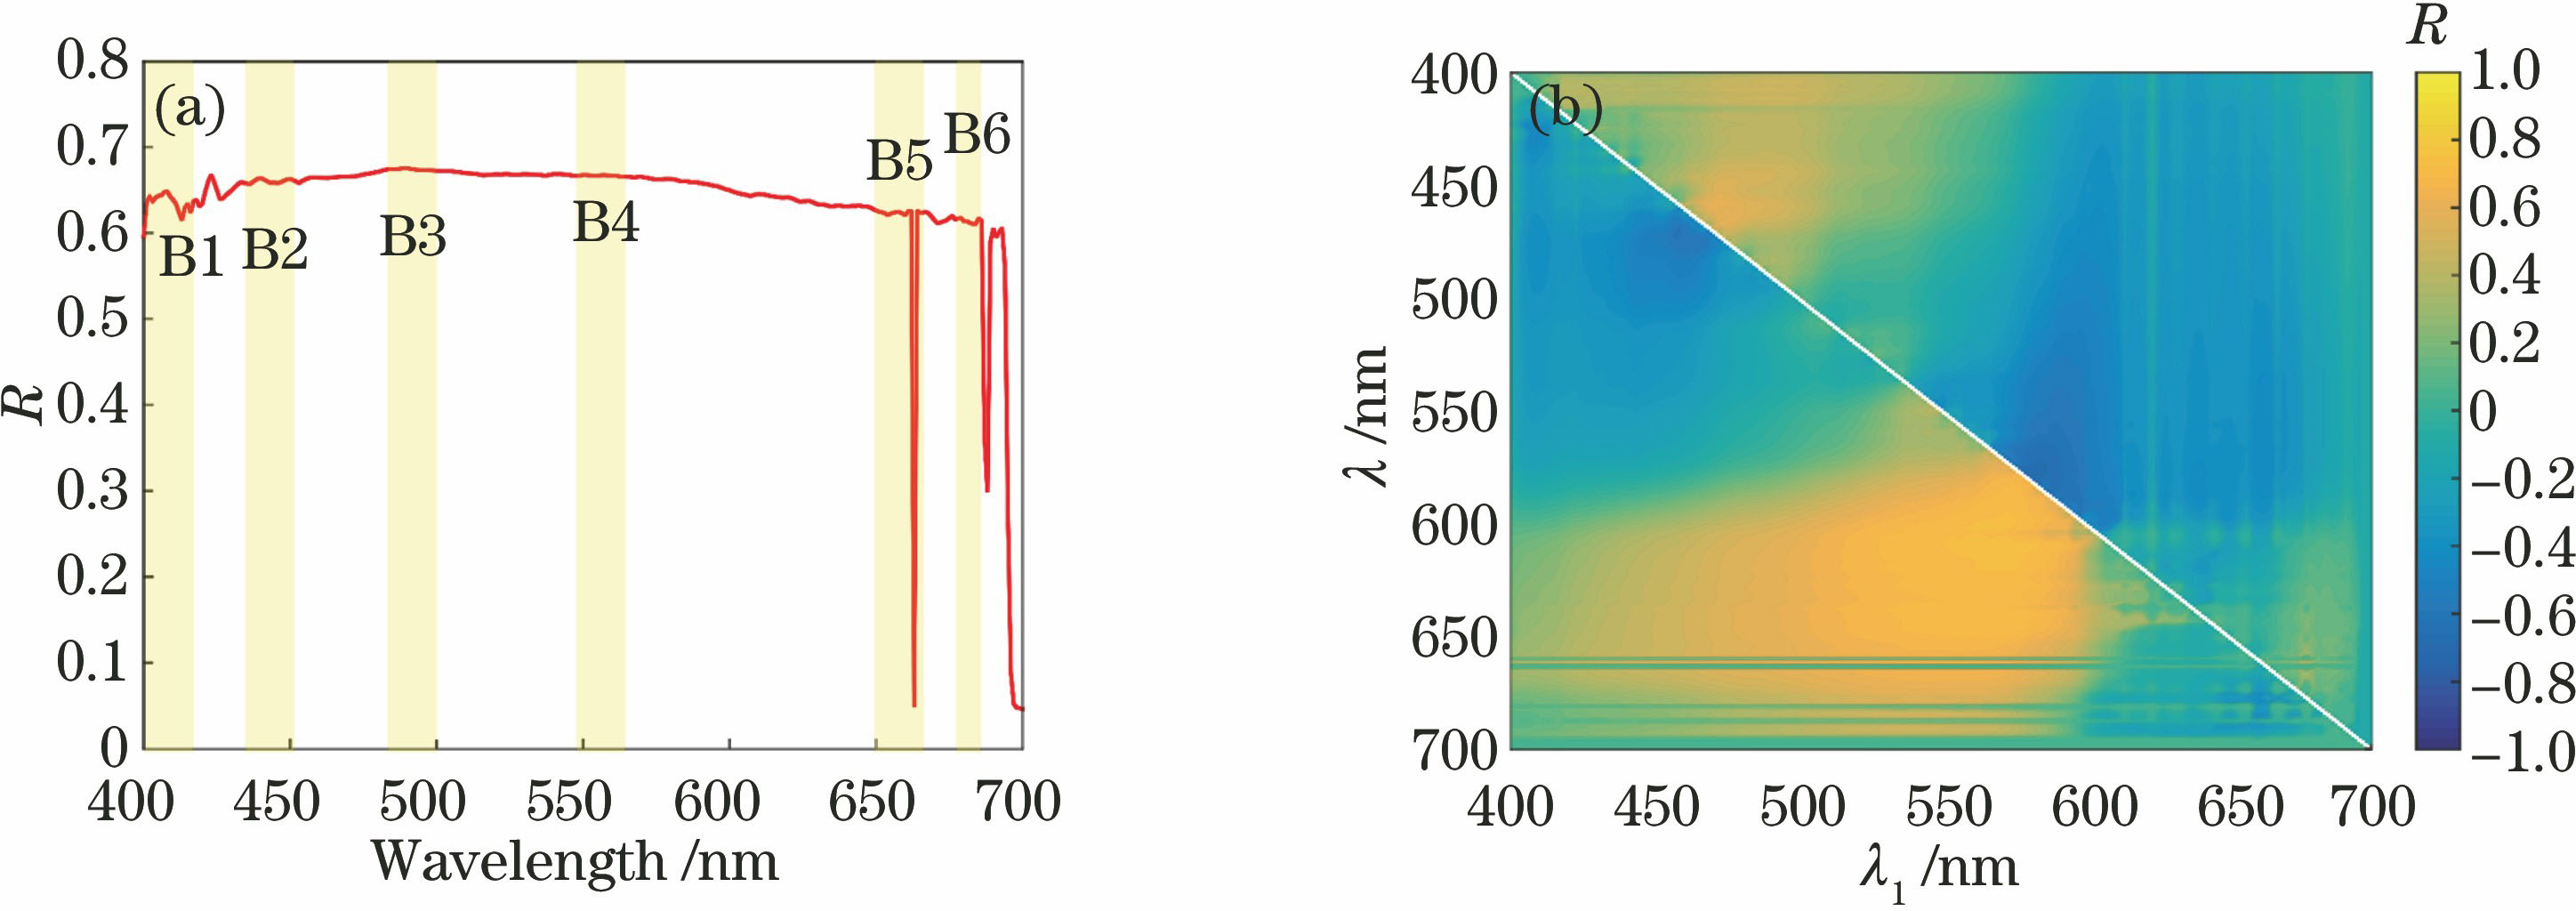
    Fig. 2. Correlation between single band, band ratio remote sensing reflectivity and SSD. (a) Rrs in single band; (b) Rrs in band ratio
    Retrieval accuracy comparison of models. (a) Model of 490 nm single band; (b) model of 555 nm single band; (c) model of 660 nm single band; (d) multiple linear regression model. Solid line is 1∶1 and dotted line is ±10% error; (e) SMAPE and SRMSE of single band models
    Fig. 3. Retrieval accuracy comparison of models. (a) Model of 490 nm single band; (b) model of 555 nm single band; (c) model of 660 nm single band; (d) multiple linear regression model. Solid line is 1∶1 and dotted line is ±10% error; (e) SMAPE and SRMSE of single band models
    Error sensitivity test result
    Fig. 4. Error sensitivity test result
    Statistical relationship analysis between SSD and total backscattering coefficient. Correlation analysis between SSD and measured backscattering coefficient in (a) 442 nm band, (b) 448 nm band, (c) 550 nm band
    Fig. 5. Statistical relationship analysis between SSD and total backscattering coefficient. Correlation analysis between SSD and measured backscattering coefficient in (a) 442 nm band, (b) 448 nm band, (c) 550 nm band
    Band /nmBand center /nmBandwidth /nmNominalradianceSaturationradianceSignal noiseratioPrimary use
    B1412201001521000Yellow substance and turbidity
    B24432092.51481090Chlorophyll absorption maximum
    B34902072.21161170Chlorophyll and other pigments
    B45552055.3871070Turbidity, suspended sediment
    B56602032611010Baseline of fluorescence signal,Chlorophyll, suspended sediment
    B66801027.147870Atmospheric correction andfluorescence signal
    B77452017.733860Atmospheric correction andbaseline of fluorescence signal
    B8865401224750Aerosol optical thickness, vegetation,and water vapor reference over the ocean
    Table 1. Spectral bands of GOCI and other related description information
    λ2 /nmCorrelation
    λ1=412 nmλ1=443 nmλ1=490 nmλ1=555 nmλ1=660 nmλ1=680 nm
    412-0.320.370.2900.17
    4430.37-0.470.260.100.26
    4900.480.50-00.100.41
    5550.220.100.10-00.46
    6600.240.300.360.41-0.37
    68000.140.200.260.10-
    Table 2. Correlation between GOCI data of Rrs(λ1)/Rrs(λ2) and SSD in Yellow and Bohai Seas off the east coast of China
    Band combinationModel typeModel equationR2SMAPESRMSE
    Exponentialy=29.932exp(0.1343x)0.623.441.30
    lg[Rrs(490)]Linear polynomialy=3.0688x +29.0950.633.441.30
    Quadratic polynomialy=0.4456x2 +4.8611x +30.790.643.301.30
    Exponentialy=29.568exp(0.1252x)0.554.021.60
    lg[Rrs(555)]Linear polynomialy= 2.8678x+28.8380.574.071.63
    Quadratic polynomialy=1.5787x2+9.4064x+35.1850.603.721.51
    Exponentialy=28.159exp(0.0817x)0.563.951.58
    lg[Rrs(660)]Linear polynomialy=1.8706x +27.7190.583.992.97
    Quadratic polynomialy=0.5237x2+4.5843x+30.9020.593.511.52
    lg[Rrs(λi)] λi=490, 555, 660 nmMultiple single bandlinear equationsEq. (5)0.703.491.04
    Table 3. Precision analysis of retrieval models of SSD and remote sensing reflectance
    Xiaoping Su, Deyong Sun, Shengqiang Wang, Zhongfeng Qiu, Yu Huan. Remote Sensing to Estimate Sea-Surface Density of Yellow and Bohai Seas off the East Coast of China[J]. Laser & Optoelectronics Progress, 2019, 56(11): 110101
    Download Citation