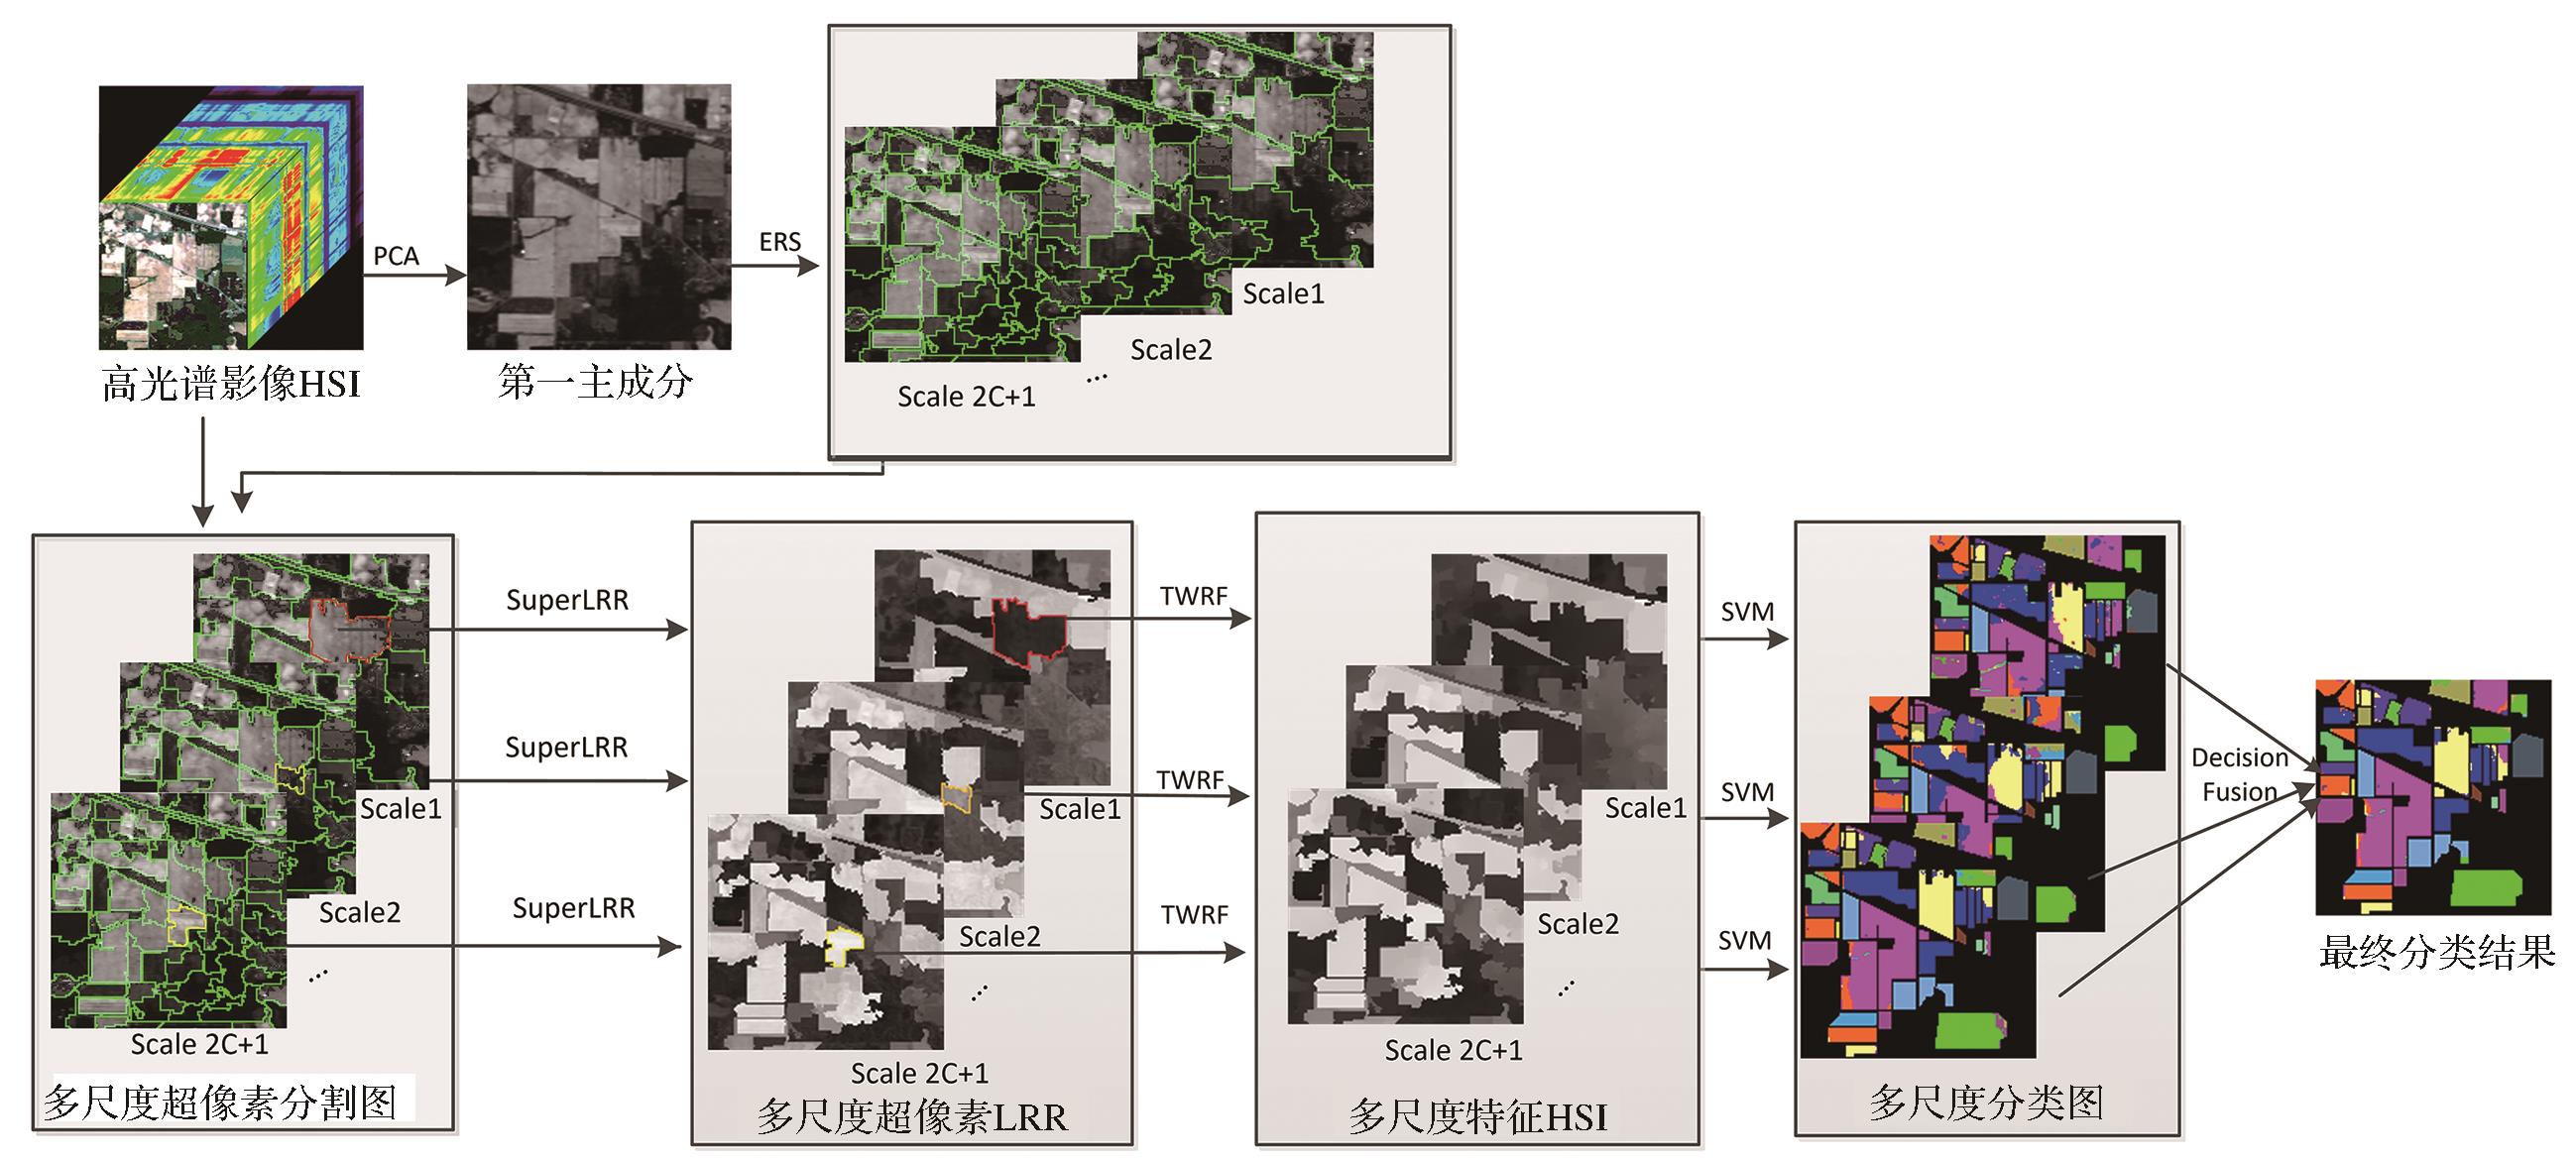
Fig. 1. The flowchart to MSLRR_TWRF
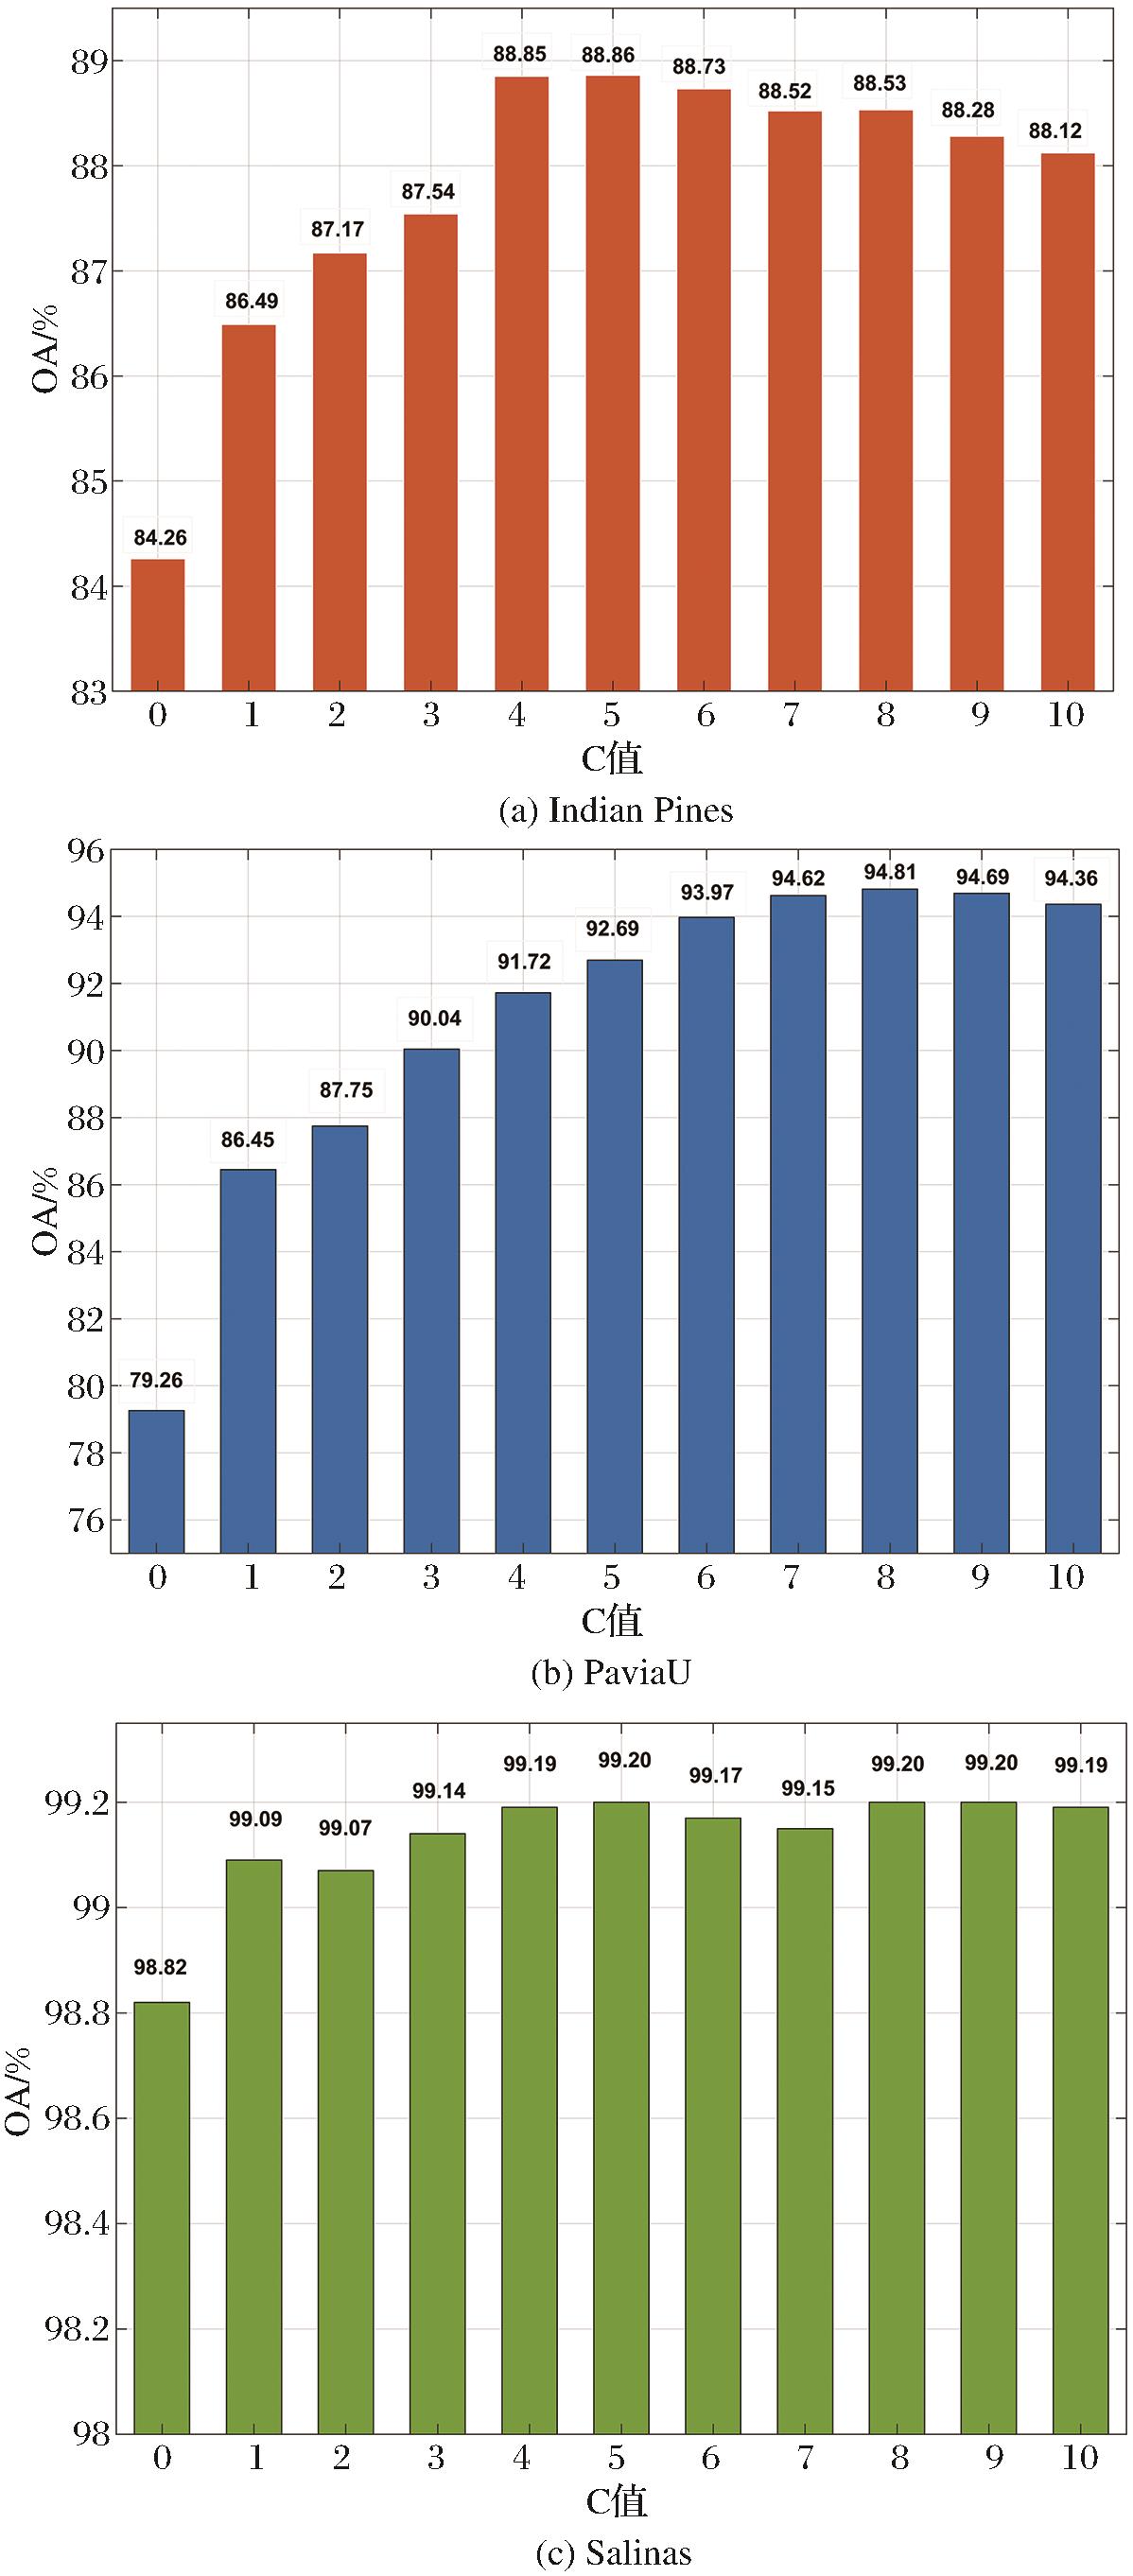
Fig. 2. Influence of parameter C on classification accuracy of MSLRR_TWRF method
Fig. 3. Influence of parameter Sf on classification accuracy of MSLRR_TWRF method
Fig. 4. Influence of parameter δr on classification accuracy of MSLRR_TWRF method
Fig. 5. Indian Pines image classification results obtained by different methods
Fig. 6. PaviaU image classification results obtained by different methods
Fig. 7. Salinas image classification results obtained by different methods
| 数据集 | 光谱范围 /nm | 空间分辨 率/m | 图像尺寸 | 波段数 | 类别数 | 带标签样本 |
|---|
| Indian Pines | 400~2 500 | 20×20 | 145×145 | 200 | 16 | 10 249 | | PaviaU | 430~860 | 1.3×1.3 | 610×340 | 103 | 9 | 42 776 | | Salinas | 400~2 500 | 3.7×3.7 | 512×217 | 204 | 16 | 54 129 |
|
Table 1. Dataset Description
| Class | Train | Test | SVM | PCA | IFRF | HiFi | CCJSR | R-VCANet | SSRN | MSLRR | MSLRR_ TWRF |
|---|
| Alfalfa | 10 | 36 | 38.81 | 23.61 | 77.45 | 98.61 | 67.24 | 100 | 90 | 98.33 | 100 | | Corn_n | 10 | 1 418 | 50.69 | 52.56 | 75.68 | 67.48 | 63.88 | 49.53 | 74.76 | 71.09 | 70.92 | | Corn_m | 10 | 820 | 42.22 | 39.41 | 62.20 | 84.87 | 64.30 | 73.49 | 73.47 | 75.51 | 79.52 | | Corn | 10 | 227 | 27.06 | 25.06 | 54.89 | 92.73 | 41.34 | 94.63 | 86.64 | 96.21 | 96.78 | | Grass_m | 10 | 473 | 75.37 | 60.97 | 88.19 | 78.48 | 95.78 | 88.92 | 95.86 | 85.67 | 86.96 | | Grass_t | 10 | 720 | 84.91 | 79.21 | 91.15 | 96.60 | 95.82 | 94.47 | 93.33 | 99.64 | 98.03 | | Grass_P | 10 | 18 | 39.69 | 26.64 | 50.84 | 98.89 | 37.46 | 100 | 79.82 | 97.78 | 97.78 | | Hay_w | 10 | 468 | 96.20 | 97.33 | 100 | 96.88 | 99.57 | 95.73 | 91.75 | 100 | 100 | | Oats | 10 | 10 | 14.18 | 21.27 | 30.77 | 100 | 13.77 | 100 | 100 | 100 | 100 | | Soybean_n | 10 | 962 | 52.26 | 39.96 | 69.67 | 85.30 | 62.36 | 76.17 | 77.54 | 84.83 | 86.75 | | Soybean_m | 10 | 2 445 | 66.89 | 63.46 | 87.61 | 70.49 | 78.69 | 65.38 | 83.93 | 89.91 | 91.90 | | Soybean_c | 10 | 583 | 33.15 | 33.63 | 77.36 | 84.15 | 68.03 | 71.90 | 79.80 | 87.32 | 91.56 | | Wheat | 10 | 195 | 79.56 | 78.75 | 76.86 | 99.33 | 90.40 | 99.18 | 98.08 | 99.49 | 99.49 | | Woods | 10 | 1 255 | 91.32 | 87.97 | 97.97 | 93.64 | 96.56 | 91.68 | 93.45 | 90.91 | 97.10 | | Buildings | 10 | 376 | 38.23 | 35.28 | 78.70 | 89.65 | 73.62 | 81.49 | 83.29 | 91.65 | 92.69 | | stone | 10 | 83 | 83.48 | 84.72 | 96.75 | 99.28 | 90.75 | 99.52 | 97.02 | 95.78 | 97.95 | | OA | / | / | 59.44±0.03 | 54.60±0.03 | 79.14±0.03 | 81.97±0.02 | 74.93±0.02 | 75.49±0.01 | 80.63±0.04 | 87.04±0.03 | 89.05±0.02 | | AA | / | / | 57.13±0.03 | 53.11±0.02 | 76.01±0.05 | 89.77±0.01 | 71.22±0.2 | 86.38±0.01 | 87.42±0.02 | 91.51±0.09 | 92.96±0.08 | | Kappa | / | / | 54.47±0.03 | 49.27±0.04 | 76.51±0.04 | 79.69±0.03 | 71.76±0.02 | 72.44±0.03 | 77.97±0.05 | 85.20±0.04 | 87.48±0.03 |
|
Table 2. Classification accuracy of different methods for Indian Pines
| Class | Train | Test | SVM | PCA | IFRF | HiFi | CCJSR | R-VCANet | SSRN | MSLRR | MSLRR_ TWRF |
|---|
| Asphalt | 10 | 18 639 | 88.79 | 66.01 | 69.94 | 72.08 | 90.98 | 70.93 | 93.22 | 84.87 | 88.77 | | Meadows | 10 | 2 089 | 84.09 | 65.53 | 94.43 | 79.36 | 84.62 | 76.75 | 95.44 | 92.16 | 95.44 | | Gravel | 10 | 3 054 | 46.35 | 57.32 | 61.05 | 78.44 | 42.07 | 87.18 | 80.10 | 94.98 | 98.23 | | Trees | 10 | 1 335 | 54.04 | 91.72 | 53.87 | 78.79 | 67.26 | 93.74 | 98.29 | 93.15 | 88.87 | | Sheets | 10 | 5 019 | 85.41 | 99.75 | 97.48 | 89.62 | 66.77 | 99.97 | 98.69 | 97.69 | 99.57 | | Soil | 10 | 1 320 | 36.31 | 56.21 | 77.53 | 77.30 | 35.68 | 85.62 | 94.77 | 84.36 | 98.74 | | Bitumen | 10 | 3 672 | 42.66 | 88.58 | 66.62 | 92.73 | 60.25 | 93.38 | 90.82 | 96.11 | 99.96 | | Bricks | 10 | 937 | 70.29 | 72.46 | 58.13 | 72.57 | 45.61 | 81.27 | 79.07 | 92.08 | 97.27 | | Shadows | 10 | 180 | 98.85 | 99.64 | 49.96 | 99.01 | 75.25 | 98.34 | 99.83 | 99.45 | 99.66 | | OA | / | / | 64.87±0.05 | 69.11±0.05 | 74.53±0.06 | 78.48±0.05 | 61.05±0.04 | 80.72±0.023 | 92.35±0.01 | 90.77±0.02 | 94.98±0.02 | | AA | / | / | 67.42±0.04 | 77.14±0.18 | 69.89±0.04 | 82.21±0.03 | 63.17±0.2 | 87.46±0.011 | 92.25±0.02 | 92.76±0.05 | 96.28±0.04 | | Kappa | / | / | 56.54±0.06 | 61.40±0.05 | 67.85±0.06 | 72.50±0.05 | 50.82±0.04 | 75.52±0.03 | 89.90±0.02 | 87.91±0.02 | 93.42±0.03 |
|
Table 3. Classification accuracy of different methods for PaviaU
| Class | Test | Train | SVM | PCA | IFRF | HiFi | CCJSR | R-VCANet | SSRN | MSLRR | MSLRR_ TWRF |
|---|
| Weeds_1 | 10 | 1 999 | 97.60 | 97.18 | 97.03 | 99.45 | 99.95 | 99.87 | 87.18 | 100 | 100 | | Weeds_2 | 10 | 3 716 | 98.93 | 98.18 | 99.98 | 99.46 | 99.47 | 99.64 | 99.82 | 99.68 | 100 | | fallow | 10 | 1 966 | 88.34 | 90.35 | 99.81 | 98.11 | 93.51 | 97.22 | 95.06 | 89.35 | 100 | | fallow_P | 10 | 1 384 | 98.31 | 98.57 | 91.47 | 98.92 | 99.17 | 99.55 | 98.73 | 98.66 | 98.36 | | Fallow_s | 10 | 2 668 | 95.96 | 97.01 | 99.63 | 97.75 | 93.04 | 99.57 | 96.72 | 96.63 | 98.34 | | stubble | 10 | 3 949 | 99.82 | 99.88 | 99.92 | 97.68 | 93.53 | 99.80 | 99.88 | 99.73 | 99.95 | | Celery | 10 | 3 569 | 95.73 | 93.21 | 98.89 | 98.83 | 98.86 | 98.94 | 99.92 | 99.59 | 99.92 | | Grapes | 10 | 11 261 | 71.62 | 68.56 | 97.48 | 66.37 | 76.58 | 70.89 | 82.71 | 80.99 | 98.43 | | Soil | 10 | 6 193 | 99.47 | 97.74 | 99.99 | 99.76 | 98.52 | 98.86 | 99.32 | 98.02 | 100 | | Corn | 10 | 3 268 | 79.98 | 86.71 | 99.66 | 84.39 | 95.65 | 86.16 | 96.19 | 88.28 | 98.27 | | Lettuce_4 | 10 | 1 058 | 83.00 | 87.09 | 98.14 | 94.04 | 91.00 | 95.43 | 95.12 | 96.77 | 100 | | Lettuce_5 | 10 | 1 917 | 91.84 | 86.98 | 97.65 | 99.93 | 95.62 | 99.95 | 97.22 | 95.33 | 98.59 | | Lettuce_6 | 10 | 906 | 88.75 | 88.49 | 92.71 | 99.44 | 77.55 | 98.79 | 97.31 | 98.13 | 97.99 | | Lettuce_7 | 10 | 1 060 | 90.98 | 95.75 | 91.65 | 95.14 | 94.15 | 95.25 | 98.67 | 96.07 | 98.51 | | Vinyard_U | 10 | 7 258 | 49.80 | 49.12 | 79.70 | 76.84 | 53.42 | 77.62 | 75.55 | 62.25 | 99.37 | | Vinyard_T | 10 | 1 797 | 97.20 | 92.22 | 99.96 | 92.75 | 99.57 | 91.93 | 99.88 | 97.39 | 99.91 | | OA | / | / | 82.71±0.02 | 82.16±0.02 | 95.07±0.01 | 87.92±0.03 | 84.94±0.02 | 89.23±0.01 | 95.07±0.03 | 88.94±0.01 | 99.23±0.01 | | AA | / | / | 89.21±0.01 | 89.19±0.01 | 96.48±0.01 | 93.68±0.01 | 91.22±0.1 | 94.34±0.01 | 94.96±0.03 | 93.55±0.1 | 99.23±0.08 | | Kappa | / | / | 80.85±0.02 | 80.20±0.02 | 94.52±0.02 | 86.61±0.03 | 83.29±0.02 | 88.04±0.01 | 89.50±0.04 | 87.66±0.01 | 99.15±0.04 |
|
Table 4. Classification accuracy of different methods for Salinas
| 方法 | 指标 | 训练样本数 |
|---|
| 10 | 20 | 30 | 40 | 50 |
|---|
| SVM | OA/% | 59.44 | 68.60 | 73.25 | 75.97 | 78.56 | | AA/% | 57.13 | 64.52 | 70.33 | 73.25 | 75.85 | | Kappa/% | 54.47 | 64.56 | 69.71 | 72.75 | 75.60 | | PCA | OA/% | 54.60 | 62.37 | 67.67 | 70.25 | 72.27 | | AA/% | 53.11 | 59.89 | 65.17 | 68.07 | 71.23 | | Kappa/% | 49.27 | 57.73 | 63.51 | 66.33 | 68.53 | | IFRF | OA/% | 79.14 | 89.85 | 93.40 | 95.33 | 96.21 | | AA/% | 76.01 | 85.70 | 92.35 | 93.82 | 95.59 | | Kappa/% | 76.51 | 88.47 | 92.47 | 94.65 | 95.66 | | HiFi | OA/% | 81.97 | 88.90 | 91.56 | 93.02 | 94.36 | | AA/% | 89.77 | 94.01 | 95.43 | 96.34 | 96.90 | | Kappa/% | 79.69 | 87.41 | 90.38 | 92.02 | 93.54 | | CCJSR | OA/% | 74.93 | 81.57 | 86.03 | 88.17 | 89.45 | | AA/% | 71.22 | 75.53 | 78.73 | 79.34 | 80.67 | | Kappa/% | 71.76 | 79.09 | 84.15 | 86.23 | 87.95 | | R-VCANet | OA/% | 75.49 | 83.23 | 86.72 | 89.16 | 91.05 | | AA/% | 86.38 | 91.33 | 94.01 | 95.08 | 95.92 | | Kappa/% | 72.44 | 80.99 | 84.95 | 87.67 | 90.12 | | SSRN | OA/% | 80.63 | 89.87 | 94.92 | 95.34 | 97.37 | | AA/% | 87.42 | 84.55 | 90.18 | 85.19 | 91.57 | | Kappav | 77.97 | 88.45 | 94.19 | 94.70 | 97.41 | | MSLRR | OA/% | 87.04 | 92.75 | 94.42 | 94.71 | 95.08 | | AA/% | 91.51 | 94.98 | 96.22 | 96.58 | 96.63 | | Kappa/% | 85.20 | 91.70 | 93.60 | 93.93 | 94.35 | | MSLRR_TWRF | OA/% | 89.05 | 94.95 | 96.82 | 97.66 | 98.00 | | AA/% | 92.96 | 96.71 | 97.93 | 98.40 | 98.59 | | Kappa/% | 87.48 | 94.21 | 96.36 | 97.32 | 97.70 |
|
Table 5. Classification accuracy of different training samples for Indian Pines
| 方法 | 指标 | 训练样本数 |
|---|
| 10 | 20 | 30 | 40 | 50 |
|---|
| SVM | OA/% | 64.87 | 75.92 | 78.44 | 82.11 | 83.19 | | AA/% | 67.42 | 75.49 | 76.49 | 79.75 | 80.36 | | Kappa/% | 56.54 | 69.28 | 72.38 | 76.89 | 78.24 | | PCA | OA/% | 69.11 | 76.38 | 77.48 | 79.19 | 81.29 | | AA/% | 77.47 | 81.82 | 83.54 | 84.86 | 86.32 | | Kappa/% | 61.40 | 69.84 | 71.38 | 73.50 | 76.04 | | IFRF | OA/% | 74.53 | 86.48 | 89.87 | 92.83 | 93.92 | | AA/% | 69.89 | 81.89 | 85.90 | 89.05 | 90.74 | | Kappa/% | 67.85 | 82.50 | 86.75 | 90.57 | 91.97 | | HiFi | OA/% | 78.48 | 85.41 | 87.52 | 88.87 | 89.92 | | AA/% | 82.21 | 88.29 | 90.29 | 91.75 | 91.90 | | Kappa/% | 72.50 | 81.18 | 83.81 | 85.55 | 86.68 | | CCJSR | OA/% | 61.05 | 64.65 | 70.16 | 75.91 | 76.23 | | AA/% | 63.17 | 63.93 | 68.49 | 71.60 | 72.82 | | Kappa/% | 50.82 | 55.59 | 61.35 | 68.63 | 69.04 | | R-VCANet | OA/% | 80.72 | 86.97 | 90.67 | 92.07 | 93.53 | | AA/% | 87.46 | 90.97 | 93.61 | 94.35 | 95.36 | | Kappa/% | 75.52 | 83.17 | 87.83 | 89.62 | 91.58 | | SSRN | OA/% | 92.35 | 94.43 | 96.49 | 96.60 | 98.09 | | AA/% | 92.25 | 94.04 | 96.31 | 96.67 | 98.01 | | Kappa/% | 89.90 | 92.60 | 95.32 | 95.48 | 97.47 | | MSLRR | OA/% | 90.77 | 94.68 | 95.50 | 96.24 | 96.78 | | AA/% | 92.76 | 95.44 | 96.22 | 96.91 | 97.34 | | Kappa/% | 87.91 | 92.98 | 94.06 | 95.03 | 95.75 | | MSLRR_TWRF | OA/% | 94.98 | 97.43 | 97.94 | 98.14 | 98.31 | | AA/% | 96.28 | 97.99 | 98.40 | 98.67 | 98.84 | | Kappa/% | 93.42 | 96.60 | 97.28 | 97.54 | 97.76 |
|
Table 6. Classification accuracy of different training samples for PaviaU
| 方法 | 指标 | 训练样本数 |
|---|
| 10 | 20 | 30 | 40 | 50 |
|---|
| SVM | OA/% | 82.71 | 84.51 | 85.52 | 87.24 | 87.36 | | AA/% | 89.21 | 90.46 | 91.77 | 92.72 | 92.94 | | Kappa/% | 80.85 | 82.81 | 83.93 | 85.81 | 85.94 | | PCA | OA/% | 82.16 | 84.98 | 85.71 | 86.31 | 87.05 | | AA/% | 89.19 | 90.99 | 91.98 | 92.41 | 92.94 | | Kappa/% | 80.20 | 83.32 | 84.13 | 84.79 | 85.60 | | IFRF | OA/% | 95.07 | 97.98 | 98.30 | 98.64 | 99.05 | | AA/% | 96.48 | 98.46 | 98.86 | 99.01 | 99.20 | | Kappa/% | 94.52 | 97.76 | 98.11 | 98.49 | 98.95 | | HiFi | OA/% | 87.90 | 91.33 | 91.79 | 92.71 | 93.09 | | AA/% | 93.68 | 95.64 | 96.07 | 96.59 | 96.86 | | Kappa/% | 86.61 | 90.37 | 90.88 | 91.88 | 92.31 | | CCJSR | OA/% | 84.94 | 86.34 | 89.35 | 89.92 | 90.20 | | AA/% | 91.22 | 91.97 | 94.09 | 94.36 | 94.44 | | Kappa/% | 83.29 | 84.85 | 88.17 | 88.76 | 89.11 | | R-VCANet | OA/% | 89.23 | 90.39 | 91.83 | 93.27 | 94.25 | | AA/% | 94.34 | 95.63 | 96.31 | 97.06 | 97.86 | | Kappa/% | 88.04 | 89.32 | 90.92 | 92.52 | 93.69 | | SSRN | OA/% | 90.57 | 89.83 | 92.49 | 95.89 | 96.94 | | AA/% | 94.96 | 96.11 | 97.34 | 97.72 | 98.50 | | Kappa/% | 89.50 | 88.75 | 91.68 | 95.42 | 96.58 | | MSLRR | OA/% | 88.94 | 90.73 | 90.92 | 91.74 | 92.00 | | AA/% | 93.55 | 95.03 | 95.35 | 95.91 | 96.10 | | Kappa/% | 87.68 | 89.65 | 89.88 | 90.79 | 91.08 | | MSLRR_TWRF | OA/% | 99.23 | 99.42 | 99.68 | 99.74 | 99.77 | | AA/% | 99.23 | 99.44 | 99.58 | 99.67 | 99.70 | | Kappa/% | 99.15 | 99.35 | 99.64 | 99.71 | 99.74 |
|
Table 7. Classification accuracy of different training samples for Salinas
| 方法 | SVM | PCA | IFRF | HiFi | CCJSR |
|---|
| Indian Pines | 4.96 | 3.59 | 3.63 | 75.44 | 64.94 | | PaviaU | 4.20 | 1.53 | 7.75 | 44.37 | 155.75 | | Salinas | 11.43 | 7.03 | 6.60 | 48.08 | 357.59 | | 方法 | R-VCANet | SSRN | MSLRR | MSLRR_TWRF | | Indian Pines | 4 785.82 | 947.78 | 310.32 | 330.06 | | PaviaU | 16 570.74 | 194.92 | 2 142.00 | 2 153.36 | | Salinas | 18 093.95 | 959.88 | 1 153.38 | 1 170.84 |
|
Table 8. Running time of different compared methods