• Laser & Optoelectronics Progress
  • Vol. 59, Issue 23, 2312001 (2022)
Chunshan Shen, Yinzhao Xia, Zongtao Xiao, Hao Zhang..., Zilong Yang and Shaowen Li*|Show fewer author(s)
Author Affiliations
  • Anhui Province Key Laboratory of Intelligent Agriculture Technology and Equipment, School of Information&Computer, Anhui Agricultural University, Hefei 230036, Anhui, China
  • show less
    DOI: 10.3788/LOP202259.2312001 Cite this Article Set citation alerts
    Chunshan Shen, Yinzhao Xia, Zongtao Xiao, Hao Zhang, Zilong Yang, Shaowen Li. Development of Plant Photosynthesis Automatic Monitor Based on Infrared Gas Analysis[J]. Laser & Optoelectronics Progress, 2022, 59(23): 2312001 Copy Citation Text show less
    Working principle diagram inside the instrument
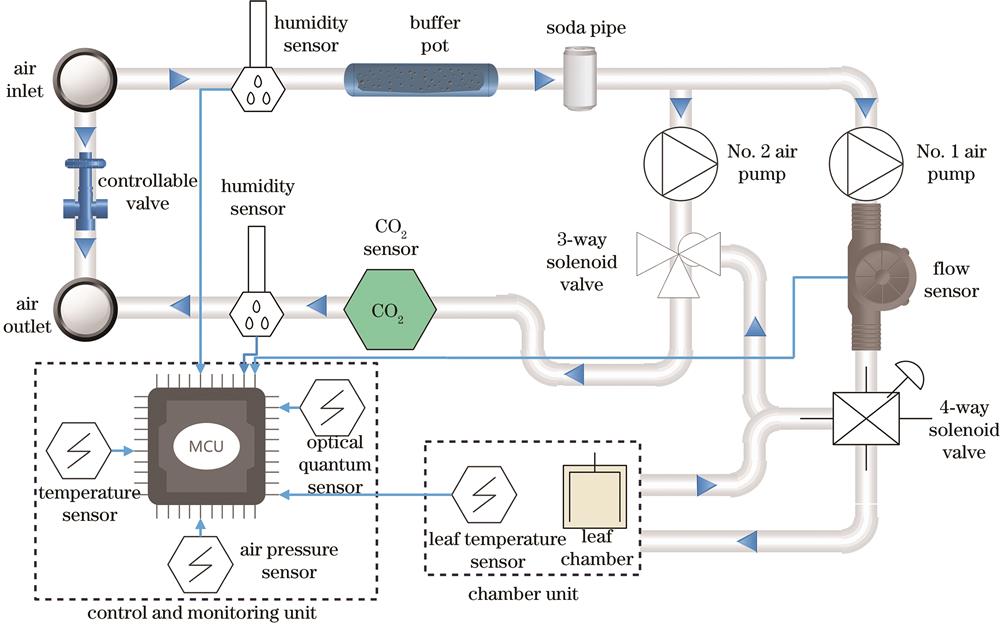
    Fig. 1. Working principle diagram inside the instrument
    Composition of the experimental equipment
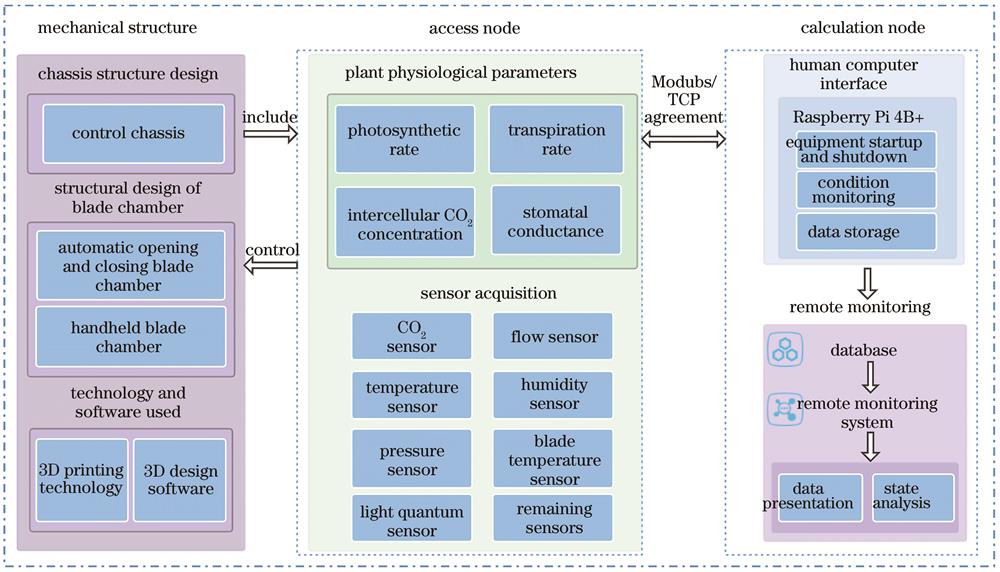
    Fig. 2. Composition of the experimental equipment
    Physical diagram of the experimental equipment
    Fig. 3. Physical diagram of the experimental equipment
    Schematic diagram of the front and rear panels of the chassis. (a) Front panel; (b) rear panel
    Fig. 4. Schematic diagram of the front and rear panels of the chassis. (a) Front panel; (b) rear panel
    Structure of the automatic opening and closing leaf chamber. (a) Overall structure; (b) structure of the drive assembly
    Fig. 5. Structure of the automatic opening and closing leaf chamber. (a) Overall structure; (b) structure of the drive assembly
    Structure of the hand-held leaf chamber. (a) Overall structure; (b) enlarged view of guide assembly; (c) enlarged view of drive assembly
    Fig. 6. Structure of the hand-held leaf chamber. (a) Overall structure; (b) enlarged view of guide assembly; (c) enlarged view of drive assembly
    Circuit block diagram of the access node
    Fig. 7. Circuit block diagram of the access node
    Workflow of the access node
    Fig. 8. Workflow of the access node
    Activity diagram of compute nodes
    Fig. 9. Activity diagram of compute nodes
    Human-computer interaction interface
    Fig. 10. Human-computer interaction interface
    Remote monitoring interface
    Fig. 11. Remote monitoring interface
    Monitoring experiments. (a) Strawberry plants; (b) geranium plants
    Fig. 12. Monitoring experiments. (a) Strawberry plants; (b) geranium plants
    Linear regression graph of photosynthetic rate of different plants. (a) Strawberry plant; (b) geranium plants
    Fig. 13. Linear regression graph of photosynthetic rate of different plants. (a) Strawberry plant; (b) geranium plants
    Multi-line graph of photosynthetic rate of different plants. (a) Strawberry plant; (b) geranium plant
    Fig. 14. Multi-line graph of photosynthetic rate of different plants. (a) Strawberry plant; (b) geranium plant
    Response time and stability test curve of the system
    Fig. 15. Response time and stability test curve of the system
    Stability test curve of the system under different CO2 concentrations. (a) 300 mol/L; (b) 500 mol/L; (c) 700 mol/L
    Fig. 16. Stability test curve of the system under different CO2 concentrations. (a) 300 mol/L; (b) 500 mol/L; (c) 700 mol/L
    NameModelMeasurement rangePrecisionOperating voltage /V
    Infrared carbon dioxide sensorJX-1030-2000 mol/L±5%(FS)9-24(DC)
    Temperature and humidity sensorSHT30-40-85 ℃,0%RH-100%RH±0.4 ℃,±3%2.4-5.5(DC)
    Blade temperature sensorLMT70-55-155 ℃±0.05 ℃2-5(DC)
    Flow sensorAWM3100V200 cm/min±0.5%(reading)8-15
    Atmospheric pressure sensorsBMP-280300-1250 hPa±1 hPa1.7-3.6(DC)
    Optical quantum sensorsRY-GH0-4000 μmol·m-2·s0-50 μV/(μmol·m-2·s)0-2.5(DC)
    Table 1. Parameters of the sensor
    CO2 concentration /(mol·L-1XBIAS /(μmol·m-2·s)XrelBIAS /%RMSE /(μmol·m-2·s)RrelMSE /%
    Overall0.0640.3450.7540.886
    3000.3450.0540.7081.185
    500-0.023-0.0030.7640.484
    700-0.1290.9840.7910.989
    Table 2. Errors of detectors under different gas concentrations
    Chunshan Shen, Yinzhao Xia, Zongtao Xiao, Hao Zhang, Zilong Yang, Shaowen Li. Development of Plant Photosynthesis Automatic Monitor Based on Infrared Gas Analysis[J]. Laser & Optoelectronics Progress, 2022, 59(23): 2312001
    Download Citation