• Laser & Optoelectronics Progress
  • Vol. 60, Issue 12, 1215006 (2023)
Hu Zhou1, Dengdeng Shu1, Chongjun Wu1,2,*, and Qibing Wang2,3
Author Affiliations
  • 1College of Mechanical Engineering, Donghua University, Shanghai 201620, China
  • 2Sicher Elevator Co., Ltd., Huzhou 313009, Zhejiang, China
  • 3College of Mechanical and Electrical Engineering, China Jiliang University, Hangzhou 200031, Zhejiang, China
  • show less
    DOI: 10.3788/LOP221608 Cite this Article Set citation alerts
    Hu Zhou, Dengdeng Shu, Chongjun Wu, Qibing Wang. Full Runout Measurement of DD Motor End Face Based on Point Cloud Drive[J]. Laser & Optoelectronics Progress, 2023, 60(12): 1215006 Copy Citation Text show less
    Point cloud of DD motor
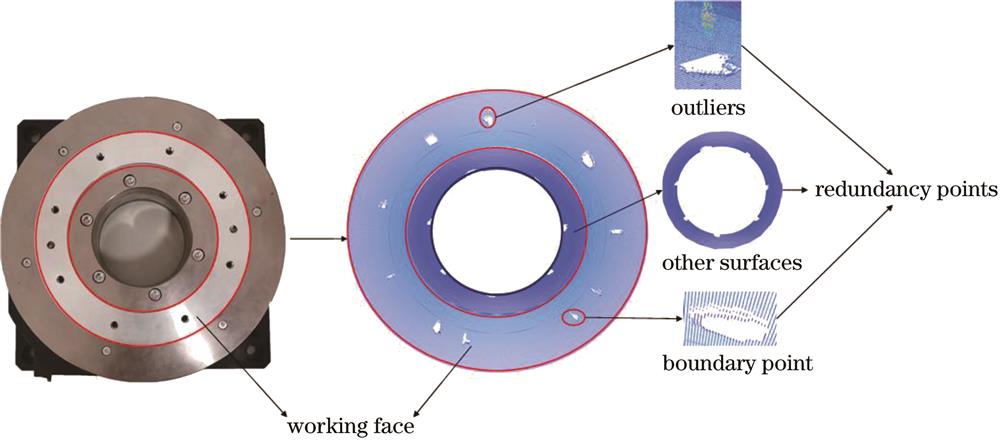
    Fig. 1. Point cloud of DD motor
    Flow chart of proposed method
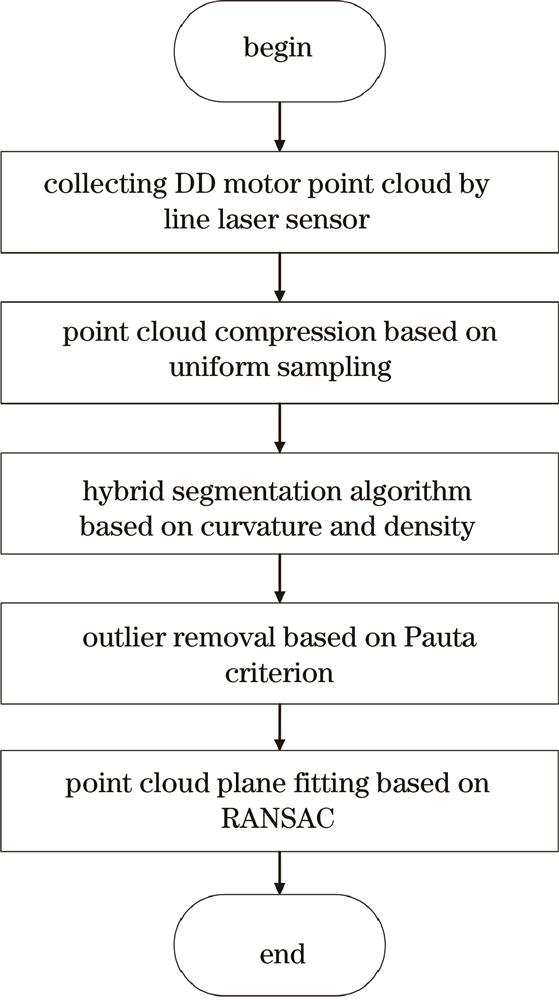
    Fig. 2. Flow chart of proposed method
    Experimental platform and collected point cloud
    Fig. 3. Experimental platform and collected point cloud
    Schematic diagram of point cloud density
    Fig. 4. Schematic diagram of point cloud density
    Flow chart of hybrid segmentation algorithm based on curvature and density
    Fig. 5. Flow chart of hybrid segmentation algorithm based on curvature and density
    Anomaly analysis of point cloud. (a) Segmented working face point cloud; (b) point cloud line chart
    Fig. 6. Anomaly analysis of point cloud. (a) Segmented working face point cloud; (b) point cloud line chart
    Verification diagrams of normal distribution of point cloud. (a) Q-Q graph of point cloud; (b) frequency histogram
    Fig. 7. Verification diagrams of normal distribution of point cloud. (a) Q-Q graph of point cloud; (b) frequency histogram
    Point cloud compression results
    Fig. 8. Point cloud compression results
    Results of point cloud segmentation. (a) c=0.5,k=25; (b) c=1.0,k=50;(c)c=1.5,k=75;(d)c=2.0,k=100
    Fig. 9. Results of point cloud segmentation. (a) c=0.5,k=25; (b) c=1.0,k=50;(c)c=1.5,k=75;(d)c=2.0,k=100
    Point cloud after outlier elimination and corresponding line chart. (a) Point cloud after outlier elimination; (b) point cloud line chart
    Fig. 10. Point cloud after outlier elimination and corresponding line chart. (a) Point cloud after outlier elimination; (b) point cloud line chart
    Measurement result
    Fig. 11. Measurement result
    Schematic diagram of dial indicator measurement
    Fig. 12. Schematic diagram of dial indicator measurement
    Points of a single contourNear field /mmFar view /mmMeasuring range /mmZ-axis resolution /μmZ-axis repeatability /μmScanning frequency /Hz
    204825.234.40-251.8-3.00.4700
    Table 1. Parameters of linear laser sensor
    ParameterabcdFitting error /μm
    t=1,k=50-0.000006-0.0000021.00000-723.20916711.15
    t=5,k=50-0.0001570.0000121.00000-723.29229711.98
    t=10,k=1000.0000170.0000161.00000-721.35791010.52
    t=15,k=1000.0000490.0000181.00000-720.95752011.32
    Table 2. Comparison of RANSAC fitting results under different parameters
    Order123456789101112
    Minimum226922542244221922012155212717541694253124832389
    Maximum227822682254222822112170213517631698253924912399
    End runout91410910158948810
    Table 3. Measurement data of left end of bolt hole
    Order131415161718192021222324
    Minimum181617921784175617621759175417471734172617541736
    Maximum182818021792176617691772176817621743174117641745
    End runout121081071314159151011
    Table 4. Measurement data of right end of bolt hole
    Hu Zhou, Dengdeng Shu, Chongjun Wu, Qibing Wang. Full Runout Measurement of DD Motor End Face Based on Point Cloud Drive[J]. Laser & Optoelectronics Progress, 2023, 60(12): 1215006
    Download Citation