• Acta Physica Sinica
  • Vol. 69, Issue 13, 130201-1 (2020)
Dan-Dan Liu1,2,3, Yin-Bo Huang1, Yu-Song Sun1,2, Xing-Ji Lu1, and Zhen-Song Cao1,*
Author Affiliations
  • 1Key Laboratory of Atmospheric Optics, Anhui Institute of Optics and Fine Mechanics, Chinese Academy of Sciences, Hefei 230031, China
  • 2Science Island Branch of Graduate School, University of Science and Technology of China, Hefei 230026, China
  • 3College of Electrical and Optoelectronic Engineering, West Anhui University, Lu’an 237012, China
  • show less
    DOI: 10.7498/aps.69.20191431 Cite this Article
    Dan-Dan Liu, Yin-Bo Huang, Yu-Song Sun, Xing-Ji Lu, Zhen-Song Cao. Influence of tropopause height on inversion of greenhouse gas column concentration in Lhasa, China[J]. Acta Physica Sinica, 2020, 69(13): 130201-1 Copy Citation Text show less
    (a) Observing site (Lhasa meteorological bureau); (b) FTIR spectrometer (EM27/SUN).
    Fig. 1. (a) Observing site (Lhasa meteorological bureau); (b) FTIR spectrometer (EM27/SUN).
    The profiles of H2O (a), HDO (b), CO2 (c), CH4 (d), CO (e), N2O (f), HF (g) and O2 (h) at different heights of top troposphere
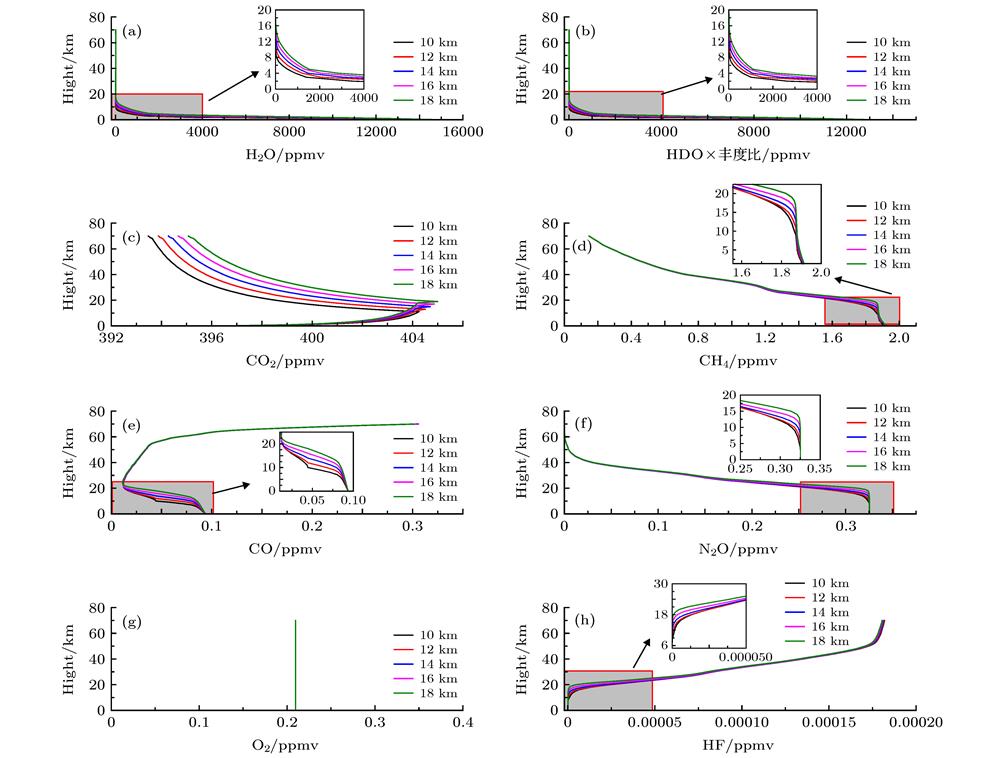
    Fig. 2. The profiles of H2O (a), HDO (b), CO2 (c), CH4 (d), CO (e), N2O (f), HF (g) and O2 (h) at different heights of top troposphere
    The diurnal variation of XH2O (a), (e), XCO2 (b), (f), XCH4 (c), (g) and XCO (d), (h) with tropopause height.
    Fig. 3. The diurnal variation of XH2O (a), (e), XCO2 (b), (f), XCH4 (c), (g) and XCO (d), (h) with tropopause height.
    Linear fit of the average mole fraction of CO2 (a), CH4 (b) and CO (c) to the top of the troposphere.
    Fig. 4. Linear fit of the average mole fraction of CO2 (a), CH4 (b) and CO (c) to the top of the troposphere.
    Time series of XH2O (a), XCO2 (b), XCH4 (c)and XCO (d).
    Fig. 5. Time series of XH2O (a), XCO2 (b), XCH4 (c)and XCO (d).
    Time series of XCO2 (a), (b)and XCH4 (c), (d)at August 7, 8, 2018.
    Fig. 6. Time series of XCO2 (a), (b)and XCH4 (c), (d)at August 7, 8, 2018.
    The correlation between XCO2 and XCH4: (a) August 6, 2018; (b) August 7, 2018; (c) August 8, 2018; (d) August 10, 2018
    Fig. 7. The correlation between XCO2 and XCH4: (a) August 6, 2018; (b) August 7, 2018; (c) August 8, 2018; (d) August 10, 2018
    72-hour back trajectories of Lhasa during August 6—16, 2018: (a) August 4-6, 2018; (b) August 7-9, 2018; (c) August 10-12, 2018; (d) August 14-16, 2018
    Fig. 8. 72-hour back trajectories of Lhasa during August 6—16, 2018: (a) August 4-6, 2018; (b) August 7-9, 2018; (c) August 10-12, 2018; (d) August 14-16, 2018
    Comparison of XCO2 (a) and XCH4 (b) based on ground-based observations and WACCM data.
    Fig. 9. Comparison of XCO2 (a) and XCH4 (b) based on ground-based observations and WACCM data.
    气体种类反演波段干扰分子
    H2O 8353.4—8463.1CH4
    CO26173.0—6390.0H2O, HDO, CH4
    CH45897.0—6145.0H2O
    CO4208.7—4318.8CH4, H2O, HDO
    O27765.0—8005.0H2O, HF, CO2
    Table 1. [in Chinese]
    Dan-Dan Liu, Yin-Bo Huang, Yu-Song Sun, Xing-Ji Lu, Zhen-Song Cao. Influence of tropopause height on inversion of greenhouse gas column concentration in Lhasa, China[J]. Acta Physica Sinica, 2020, 69(13): 130201-1
    Download Citation