
Katarzyna Liliana Batani, Sophia Malko, Michael Touati, Jean-Luc Feugeas, Amit D. Lad, Kamalesh Jana, G. Ravindra Kumar, Didier Raffestin, Olena Turianska, Dimitri Khaghani, Alessandro Tentori, Donaldi Mancelli, Artem S. Martynenko, Sergey Pikuz, Roberto Benocci, Luca Volpe, Ghassan Zeraouli, Jose Antonio Perez Hernandez, Enrique Garcia, Venkatakrishnan Narayanan, Joao Santos, Dimitri Batani, "Characterization of blast waves induced by femtosecond laser irradiation in solid targets," High Power Laser Sci. Eng. 12, 05000e59 (2024)
- High Power Laser Science and Engineering
- Vol. 12, Issue 5, 05000e59 (2024)
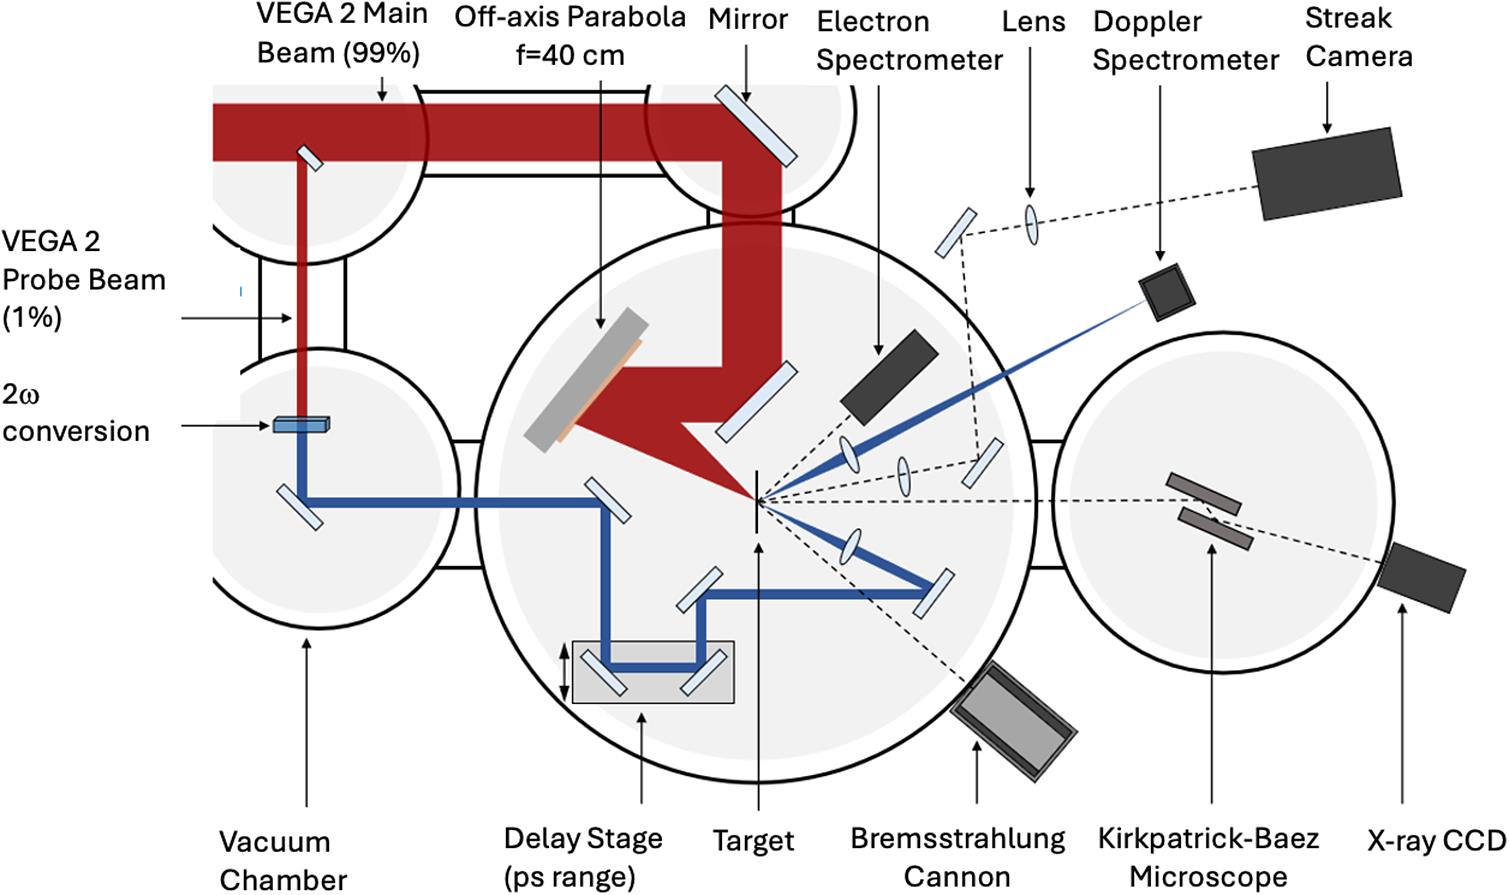
Fig. 1. Scheme of the experimental setup and diagnostics used in the experiment.
![Scheme of the BSC and the filter stack used in the experiment. The table on the right shows the cut-off energy for each imaging plate (IP), that is, the X-ray photon energy below which the IP is practically insensitive. This is calculated taking into account the sensitivity of the IP (according to Boutoux et al.[20" target="_self" style="display: inline;">20]) and the transmission of all filters and the IP placed before them.](/richHtml/hpl/2024/12/5/05000e59/img_2.png)
Fig. 2. Scheme of the BSC and the filter stack used in the experiment. The table on the right shows the cut-off energy for each imaging plate (IP), that is, the X-ray photon energy below which the IP is practically insensitive. This is calculated taking into account the sensitivity of the IP (according to Boutoux et al. [20]) and the transmission of all filters and the IP placed before them.
Fig. 3. Self-emission signal recorded for foils of 50 μm Al + 2 μm Ti on the target rear side with an OG540 nm filter: (left) typical streak camera image (time window 10 ns) and (right) lineout of the signal (obtained from the average of six shots done in identical conditions).
Fig. 4. ‘Shock breakout time’ as measured at the half-rise of the later emission as a function of target thickness for Al targets only and linear interpolation.
Fig. 5. Measured Doppler shift versus time delay for a 30 μm Al target. The dashed line is a guide for the eyes.
Fig. 6. Results from the electron spectrometer for a 25 μm Al foil target (with 2 μm Ti).
Fig. 7. Results from the BSC and interpolation using the formula in the figure for the photon distribution.
Fig. 8. Contours of parameters ( ) leading to a reduced χ2 = 1 in the analysis of data from the BSC obtained with a 25 μm target. The blue and red points correspond respectively to the best fit of BSC data (
T = 361.6 keV and A = 7.8 × 10⁸) and to the use of the HE distribution from the ES (where A = 1.7 × 10⁹ and T = 270 keV).
) leading to a reduced χ2 = 1 in the analysis of data from the BSC obtained with a 25 μm target. The blue and red points correspond respectively to the best fit of BSC data (Fig. 9. (Left) Photon distribution obtained from Geant4 by injecting the two-temperature hot electron distribution measured with the electron spectrometer in the target (Al 25 μm) and calculating the produced bremsstrahlung emission. (Right) Calculation of BSC data with the photon distribution shown on the left.
Fig. 10. (Left) K-α X-ray image. Image of the target rear side obtained with the KB microscope for a 30 μm Al target with a Ti final layer. (Right) Variation of measured K-α spot size with target foil thickness (Al targets only).
Fig. 11. Interaction of the laser prepulse with a 20 μm Al foil target. The laser is a 10 ns long Gaussian laser pulse of 5.89 μm FWHM and power P = 1.1 × 10⁵ W. (Left) 2D density profile in log scale at time t = 5.05 ns. (Right) Density profile along the laser axis (r = 0) showing that the shock has roughly crossed half of the target thickness (the initial target front side position corresponds to z = 30 μm).
Fig. 12. Time averaged angular distribution of accelerated electrons obtained from SMILEI simulations.
Fig. 13. Ionization degree (left) and electrical resistivity (right) of Al versus temperature at solid-state density, as used in the code AMORE.
Fig. 14. Hybrid simulations showing the heating of the target as a function of time, due to the propagation of the fast electron beam in a 70-μm thick Al target. Hot electron recirculation at the target rear side is taken into account. At 400 fs we clearly see the presence of a second heating front coming back into the target.
Fig. 15. Temperature profile in a 70 μm Al target following HE energy deposition.
Fig. 16. Pressure evolution in a 30 μm Al target as a function of time (CHIC simulations). 2D plots taken respectively at 0.05, 0.45, 1.5, 2.5, 3.5 and 5 ns.
Fig. 17. Pressure profile in a 30 μm Al target along the central axis (r = 0) as a function of time.
Fig. 18. MULTI simulation of rear-side expansion of a 30 μm Al foil following an instantaneous isochoric heating producing a target rear-side temperature of  60 eV. The left-hand bottom dashed line shows the trajectory of the solid density layer moving backward inside the material with velocity
  5
5  106 cm/s. The right-hand dashed line shows the trajectory of the critical surface with velocity of
  9
9  106 cm/s.
60 eV. The left-hand bottom dashed line shows the trajectory of the solid density layer moving backward inside the material with velocity 5 106 cm/s. The right-hand dashed line shows the trajectory of the critical surface with velocity of 9 106 cm/s. Fig. 19. Ionization degree and collision frequency in solid-state aluminum isochorically heated to a temperature T at solid-state density (2.7 g/cm3) and the resulting behavior of the phase shift (δr) in reflection of an electromagnetic wave (400 nm) at normal incidence on the surface.


Set citation alerts for the article
Please enter your email address

© Copyright 2018-2021 | Chinese Laser Press. All Rights Reserved 沪ICP备15018463号-20