Author Affiliations
1College of Computer Science and Technology, China University of Petroleum (East China), Qingdao 266580, Shandong, China2State Grid Shandong Electric Power Company, Jinan 250003, Shandong, China3Department of Information Management, the National Police University for Criminal Justice, Baoding 071000, Hebei, Chinashow less
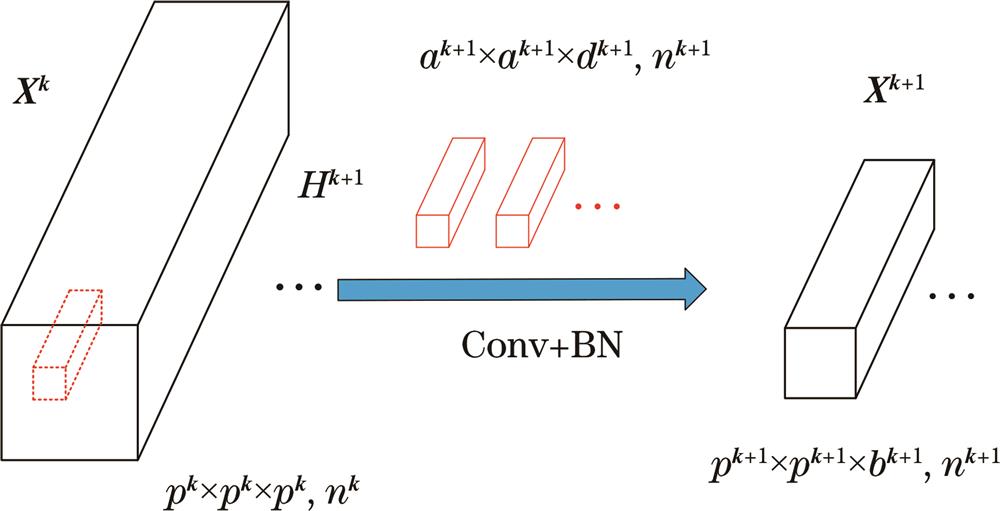
Fig. 1. 3D-CNN with batch normalization
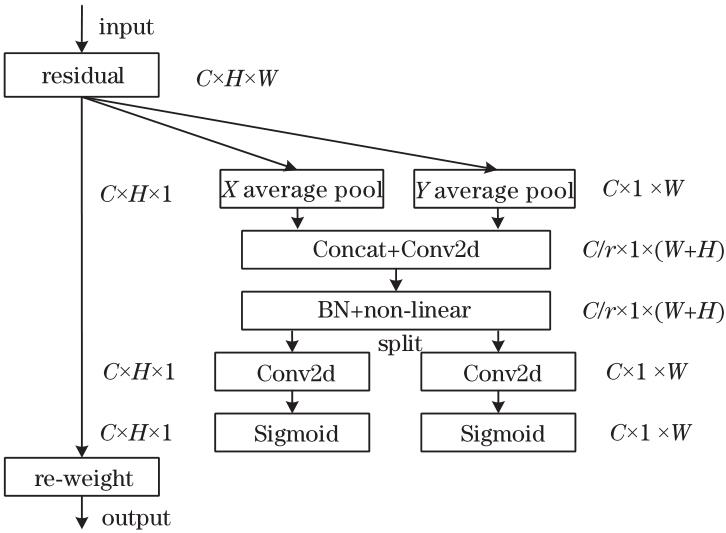
Fig. 2. Architecture diagram of CA
Fig. 3. Multiple-branch construction
Fig. 4. Structure of multi-branch block
Fig. 5. DCFE network structure
Fig. 6. Classification result diagrams of IP dataset. (a) Ground truth; (b)-(g) classification results of different methods
Fig. 7. Classification result diagrams of UP dataset. (a) Ground-truth; (b)-(g) classification results of different methods
Fig. 8. Classification result diagram of SV dataset. (a) Ground-truth; (b)-(g) classification results of different methods
Fig. 9. Classification result diagram of BS dataset. (a) Ground-truth; (b)-(g) classification results of different methods
| Layer name | Kernel size | Output size |
|---|
| Input | | (11×11×200) | | Conv | (1×1×7) | (11×11×97,24) | | Spectral block | (1×1×7) | (11×11×97,24) | | BN-Mish-Conv | (1×1×97) | (11×11×1,24) |
|
Table 1. Implementation of spectral-channel
| Layer name | Kernel size | Output size |
|---|
| Input | | (11×11×200) | | Conv | (1×1×200) | (11×11×1,24) | | Spatial block | (3×3×1) | (11×11×1,24) |
|
Table 2. Implementation of spatial-channel
| Layer name | Kernel size | Output size |
|---|
| Concatenate | | (11×11×1,48) | | Attention block | | (11×11×1,48) | | BN-Mish-dropout-GAP | | (1×48) | | Fully connected | | (1×16) |
|
Table 3. Implementation of classification module
| Order | Class | Number | Training set | Verification set | Test set |
|---|
| Total | 10249 | 307 | 307 | 9635 | | 1 | alfalfa | 46 | 3 | 3 | 40 | | 2 | corn-notill | 1428 | 42 | 42 | 1344 | | 3 | corn-mintill | 830 | 24 | 24 | 782 | | 4 | corn | 237 | 7 | 7 | 223 | | 5 | grass-pasture | 483 | 14 | 14 | 455 | | 6 | grass-trees | 730 | 21 | 21 | 688 | | 7 | grass-pasture-mowed | 28 | 3 | 3 | 22 | | 8 | hay-windrowed | 478 | 14 | 14 | 450 | | 9 | oats | 20 | 3 | 3 | 14 | | 10 | soybean-notill | 972 | 29 | 29 | 914 | | 11 | soybean-mintill | 2455 | 73 | 73 | 2309 | | 12 | soybean-clean | 593 | 17 | 17 | 559 | | 13 | wheat | 205 | 6 | 6 | 193 | | 14 | woods | 1265 | 37 | 37 | 1191 | | 15 | buildings-grass-tree-drives | 386 | 11 | 11 | 364 | | 16 | stone-steel-towers | 93 | 3 | 3 | 87 |
|
Table 4. Samples for each category of training, validation, and testing for IP dataset
| Order | Class | Number | Training set | Verification set | Test set |
|---|
| Total | 42776 | 210 | 210 | 42356 | | 1 | asphalt | 6631 | 33 | 33 | 6465 | | 2 | meadows | 18649 | 93 | 93 | 18463 | | 3 | gravel | 2099 | 10 | 10 | 2079 | | 4 | corn | 3064 | 15 | 15 | 3034 | | 5 | trees | 1345 | 6 | 6 | 1333 | | 6 | bare soil | 5029 | 25 | 25 | 4979 | | 7 | bitumen | 1330 | 6 | 6 | 1318 | | 8 | self-blocking bricks | 3682 | 18 | 18 | 3646 | | 9 | shadows | 947 | 4 | 4 | 939 |
|
Table 5. Samples for each category of training, validation, and testing for UP dataset
| Order | Class | Number | Training set | Verification set | Test set |
|---|
| Total | 54129 | 263 | 263 | 53603 | | 1 | brocoli-green-weeds-1 | 2009 | 10 | 10 | 1989 | | 2 | brocoli-green-weeds-2 | 3726 | 18 | 18 | 3690 | | 3 | fallow | 1976 | 9 | 9 | 1958 | | 4 | fallow-rough-plow | 1394 | 6 | 6 | 1382 | | 5 | fallow-smooth | 2678 | 13 | 13 | 2652 | | 6 | stubble | 3959 | 19 | 19 | 3921 | | 7 | celery | 3579 | 17 | 17 | 3545 | | 8 | grapes-untrained | 11271 | 56 | 56 | 11159 | | 9 | soil-vinyard-develop | 6203 | 31 | 31 | 6141 | | 10 | corn-senesced-green-weeds | 3278 | 16 | 16 | 3246 | | 11 | lettuce-romaine-4wk | 1068 | 5 | 5 | 1058 | | 12 | lettuce-romaine-5wk | 1927 | 9 | 9 | 1909 | | 13 | lettuce-romaine-6wk | 916 | 4 | 4 | 908 | | 14 | lettuce-romaine-7wk | 1070 | 5 | 5 | 1060 | | 15 | vinyard-untrained | 7268 | 36 | 36 | 7196 | | 16 | vinyard-vertical-trellis | 1807 | 9 | 9 | 1789 |
|
Table 6. Samples for each category of training, validation, and testing for SV dataset
| Order | Class | Number | Training set | Verification set | Test set |
|---|
| Total | 3248 | 40 | 40 | 3168 | | 1 | water | 270 | 3 | 3 | 264 | | 2 | hippo grass | 101 | 2 | 2 | 97 | | 3 | floodplain grasses 1 | 251 | 3 | 3 | 245 | | 4 | floodplain grasses 2 | 215 | 3 | 3 | 209 | | 5 | reeds 1 | 269 | 3 | 3 | 263 | | 6 | riparian | 269 | 3 | 3 | 263 | | 7 | fierscar 2 | 259 | 3 | 3 | 253 | | 8 | island interior | 203 | 3 | 3 | 197 | | 9 | acacia woodlands | 314 | 4 | 4 | 306 | | 10 | acacia shrublands | 248 | 3 | 3 | 242 | | 11 | acacia grasslands | 305 | 4 | 4 | 297 | | 12 | short mopane | 181 | 2 | 2 | 177 | | 13 | mixed mopane | 269 | 3 | 3 | 263 | | 14 | exposed soils | 95 | 1 | 1 | 93 |
|
Table 7. Samples for each category of training, validation, and testing for BS dataset
| Class | Color | SVM | SSRN | FDSSC | DBMA | DBDA | DCFE |
|---|
| 1 /% | | 24.19 | 67.39 | 97.72 | 61.76 | 87.50 | 100 | | 2 /% | | 56.71 | 84.58 | 98.74 | 92.30 | 94.22 | 98.13 | | 3 /% | | 65.09 | 92.49 | 97.31 | 97.93 | 98.32 | 94.61 | | 4 /% | | 39.63 | 91.37 | 97.20 | 96.15 | 98.18 | 96.81 | | 5 /% | | 87.33 | 99.04 | 99.53 | 98.00 | 100 | 97.63 | | 6 /% | | 83.87 | 96.18 | 92.83 | 94.86 | 96.34 | 95.91 | | 7 /% | | 57.20 | 88 | 100 | 52.94 | 83.33 | 90.90 | | 8 /% | | 89.28 | 95.70 | 100 | 100 | 100 | 97.59 | | 9 /% | | 22.58 | 57.14 | 88.88 | 50.00 | 100 | 100 | | 10 /% | | 66.70 | 78.33 | 88.92 | 95.52 | 91.16 | 94.77 | | 11 /% | | 62.50 | 95.83 | 99.23 | 95.99 | 97.47 | 96.84 | | 12 /% | | 51.86 | 85.57 | 97.16 | 86.89 | 97.61 | 95.63 | | 13 /% | | 94.79 | 91.86 | 98.90 | 100 | 97.95 | 100 | | 14 /% | | 90.42 | 91.90 | 93.44 | 92.81 | 95.86 | 96.88 | | 15 /% | | 62.82 | 90.76 | 95.92 | 90.93 | 93.67 | 96.24 | | 16 /% | | 98.46 | 100 | 92.30 | 92.22 | 92.30 | 93.18 | | OA /% | | 69.35 | 90.52 | 96.14 | 93.14 | 96.19 | 96.57 | | AA /% | | 65.86 | 87.88 | 96.15 | 86.77 | 95.24 | 96.57 | | Kappa /% | | 64.65 | 89.21 | 95.44 | 92.18 | 95.65 | 96.09 | | Training time /s | | 12.23 | 56.06 | 132.43 | 108.67 | 78.96 | 75.41 | | Test time /s | | 1.39 | 3.39 | 5.65 | 7.68 | 6.83 | 7.33 |
|
Table 8. Classification results of IP dataset of 3% training samples
| Class | Color | SVM | SSRN | FDSSC | DBMA | DBDA | DCFE |
|---|
| 1 /% | | 80.26 | 94.81 | 98.88 | 93.67 | 96.24 | 96.49 | | 2 /% | | 86.94 | 98.50 | 98.82 | 96.34 | 99.23 | 99.26 | | 3 /% | | 71.13 | 100 | 100 | 99.02 | 99.87 | 99.44 | | 4 /% | | 96.44 | 100 | 91.74 | 97.43 | 98.20 | 98.78 | | 5 /% | | 90.85 | 99.32 | 99.92 | 99.55 | 99.92 | 99.92 | | 6 /% | | 77.02 | 93.43 | 99.61 | 98.67 | 98.06 | 99.97 | | 7 /% | | 69.70 | 95.96 | 100 | 98.50 | 100 | 99.21 | | 8 /% | | 67.30 | 75.87 | 84.02 | 82.48 | 84.11 | 91.19 | | 9 /% | | 99.89 | 99.68 | 99.66 | 96.88 | 100 | 99.33 | | OA /% | | 83.07 | 94.85 | 97.02 | 95.06 | 97.11 | 98.15 | | AA /% | | 82.24 | 95.28 | 96.96 | 95.84 | 97.29 | 98.18 | | Kappa /% | | 77.07 | 93.17 | 96.04 | 93.40 | 96.17 | 97.54 | | Training time /s | | 5.32 | 12.06 | 32.16 | 29.83 | 21.88 | 20.12 | | Test time /s | | 2.19 | 5.21 | 13.22 | 13.52 | 11.25 | 12.10 |
|
Table 9. Classification results of UP dataset of 0.5% training samples
| Class | Color | SVM | SSRN | FDSSC | DBMA | DBDA | DCFE |
|---|
| 1 /% | | 99.84 | 100 | 100 | 100 | 100 | 100 | | 2 /% | | 98.95 | 100 | 97.20 | 100 | 97.84 | 100 | | 3 /% | | 89.87 | 94.35 | 99.58 | 99.57 | 96.92 | 100 | | 4 /% | | 97.30 | 95.63 | 96.91 | 90.26 | 97.71 | 94.33 | | 5 /% | | 93.55 | 99.40 | 100 | 97.66 | 99.26 | 100 | | 6 /% | | 99.79 | 100 | 99.74 | 100 | 99.97 | 99.77 | | 7 /% | | 91.33 | 99.46 | 100 | 91.90 | 99.88 | 100 | | 8 /% | | 74.73 | 89.14 | 95.15 | 95.62 | 96.53 | 97.32 | | 9 /% | | 97.69 | 99.51 | 89.31 | 99.69 | 98.76 | 100 | | 10 /% | | 90.01 | 97.75 | 98.17 | 97.38 | 97.70 | 99.28 | | 11 /% | | 75.92 | 92.97 | 93.17 | 81.76 | 95.40 | 95.49 | | 12 /% | | 95.19 | 99.63 | 98.35 | 95.93 | 99.79 | 100 | | 13 /% | | 94.86 | 99.88 | 100 | 99.88 | 100 | 100 | | 14 /% | | 89.26 | 98.04 | 95.92 | 97.62 | 96.00 | 97.78 | | 15 /% | | 75.85 | 87.95 | 91.94 | 89.97 | 94.47 | 99.03 | | 16 /% | | 99.03 | 100 | 100 | 100 | 100 | 100 | | OA /% | | 88.09 | 95.35 | 95.85 | 95.90 | 97.70 | 98.95 | | AA /% | | 91.45 | 97.11 | 97.21 | 96.08 | 98.14 | 98.93 | | Kappa /% | | 86.70 | 94.82 | 95.38 | 95.44 | 97.44 | 98.83 | | Training time /s | | 10.27 | 85.65 | 123.14 | 146.28 | 82.33 | 80.56 | | Test time /s | | 4.12 | 16.32 | 31.05 | 42.56 | 25.67 | 23.66 |
|
Table 10. Classification results of SV dataset of 0.5% training samples
| Class | Color | SVM | SSRN | FDSSC | DBMA | DBDA | DCFE |
|---|
| 1 /% | | 100 | 100 | 83.95 | 96.33 | 95.97 | 93.26 | | 2 /% | | 70.70 | 95.83 | 78.40 | 100 | 98.00 | 95.14 | | 3 /% | | 84.10 | 100 | 95.57 | 100 | 100 | 100 | | 4 /% | | 65.95 | 81.18 | 82.82 | 89.40 | 85.77 | 86.12 | | 5 /% | | 82.62 | 84.55 | 100 | 99.45 | 98.96 | 92.30 | | 6 /% | | 65.71 | 93.24 | 62.11 | 80.18 | 87.04 | 95.45 | | 7 /% | | 78.77 | 94.75 | 98.82 | 84.33 | 100 | 96.93 | | 8 /% | | 65.87 | 97.51 | 100 | 100 | 99.49 | 100 | | 9 /% | | 75.18 | 81.74 | 100 | 100 | 91.04 | 100 | | 10 /% | | 69.82 | 100 | 97.60 | 99.18 | 100 | 97.99 | | 11 /% | | 95.49 | 100 | 99.00 | 99.32 | 100 | 100 | | 12 /% | | 93.10 | 100 | 93.12 | 94.62 | 100 | 100 | | 13 /% | | 76.25 | 100 | 100 | 100 | 100 | 100 | | 14 /% | | 90.41 | 100 | 100 | 100 | 100 | 100 | | OA /% | | 78.63 | 94.27 | 90.80 | 94.87 | 96.39 | 96.83 | | AA /% | | 79.57 | 94.91 | 92.45 | 95.91 | 96.87 | 96.94 | | Kappa /% | | 76.87 | 93.79 | 90.03 | 94.45 | 96.09 | 96.57 | | Training time /s | | 1.65 | 10.25 | 22.35 | 20.88 | 18.65 | 19.39 | | Test time /s | | 0.41 | 2.01 | 2.37 | 3.02 | 2.11 | 2.04 |
|
Table 11. Classification results of BS dataset of 1.2% training samples
| Algorithm | 0.5% | 1% | 3% | 5% | 10% |
|---|
| SVM | 48.53 | 55.95 | 69.35 | 74.74 | 80.55 | | SSRN | 64.99 | 81.40 | 90.52 | 0.955 | 97.84 | | FDSSC | 70.75 | 84.71 | 96.14 | 97.21 | 98.02 | | DBMA | 59.33 | 77.64 | 93.14 | 93.75 | 96.91 | | DBDA | 56.97 | 78.81 | 96.19 | 96.58 | 97.55 | | DCFE | 74.10 | 86.54 | 96.57 | 97.83 | 98.34 |
|
Table 12. OA for different proportions of training samples in IP
| Algorithm | 0.1% | 0.5% | 1% | 3% | 5% |
|---|
| SVM | 70.59 | 83.07 | 88.45 | 90.35 | 93.29 | | SSRN | 78.32 | 94.85 | 97.11 | 99.43 | 99.69 | | FDSSC | 88.97 | 97.02 | 97.74 | 99.50 | 99.58 | | DBMA | 89.87 | 95.06 | 96.37 | 99.10 | 99.49 | | DBDA | 88.01 | 97.11 | 98.40 | 99.07 | 99.33 | | DCFE | 90.79 | 98.15 | 98.66 | 99.99 | 99.99 |
|
Table 13. OA for different proportions of training samples in UP
| Algorithm | 0.1% | 0.5% | 1% | 3% | 5% |
|---|
| SVM | 78.65 | 88.09 | 89.89 | 91.24 | 92.47 | | SSRN | 67.22 | 95.35 | 96.32 | 97.23 | 98.14 | | FDSSC | 88.83 | 95.85 | 96.48 | 97.52 | 98.85 | | DBMA | 92.15 | 95.90 | 96.66 | 97.62 | 98.21 | | DBDA | 94.23 | 97.70 | 98.31 | 98.95 | 99.36 | | DCFE | 95.70 | 98.95 | 99.25 | 99.81 | 99.98 |
|
Table 14. OA for different proportions of training samples in SV
| Algorithm | 0.5% | 1.2% | 3% | 5% | 10% |
|---|
| SVM | 73.53 | 78.63 | 87.82 | 89.06 | 92.76 | | SSRN | 84.07 | 94.27 | 95.52 | 98.19 | 99.15 | | FDSSC | 87.98 | 90.80 | 96.33 | 97.24 | 99.46 | | DBMA | 93.36 | 94.87 | 95.88 | 98.01 | 99.04 | | DBDA | 96.27 | 96.39 | 97.38 | 98.64 | 99.33 | | DCFE | 96.66 | 96.83 | 99.24 | 99.62 | 99.80 |
|
Table 15. OA for different proportions of training samples in BS