• Laser & Optoelectronics Progress
  • Vol. 59, Issue 22, 2228001 (2022)
Shanen Yu, Wendong Yang, and Huajun Li*
Author Affiliations
  • School of Automation, Hangzhou Dianzi University, Hangzhou 310018, Zhejiang, China
  • show less
    DOI: 10.3788/LOP202259.2228001 Cite this Article Set citation alerts
    Shanen Yu, Wendong Yang, Huajun Li. Research on the Structure of an Optical Tomography Sensor Based on Numerical Simulations[J]. Laser & Optoelectronics Progress, 2022, 59(22): 2228001 Copy Citation Text show less
    Flow chart of simulation process
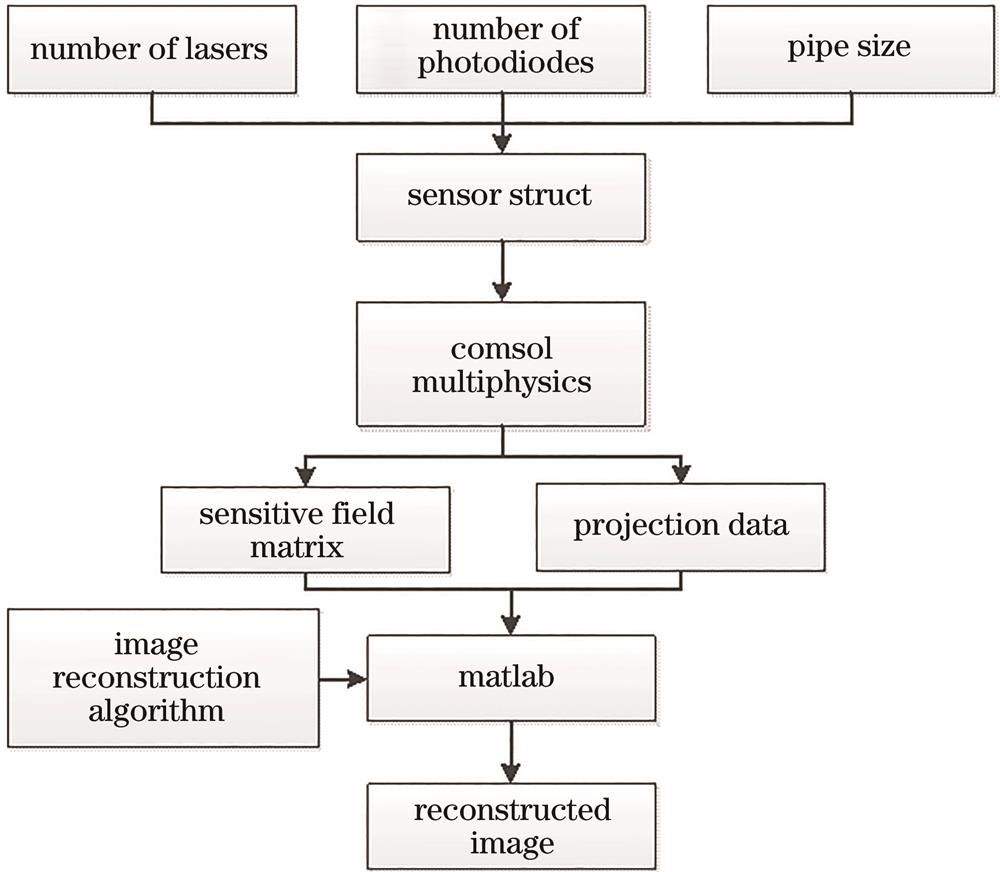
    Fig. 1. Flow chart of simulation process
    Sensitive fields of different structures
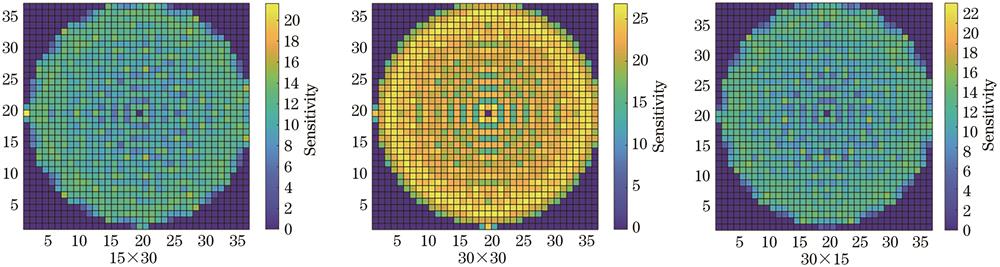
    Fig. 2. Sensitive fields of different structures
    Light trace diagram (laser 1 working)
    Fig. 3. Light trace diagram (laser 1 working)
    Structure diagrams of laser photodiode matching array
    Fig. 4. Structure diagrams of laser photodiode matching array
    Relative image curve
    Fig. 5. Relative image curve
    Correlation coefficient curve
    Fig. 6. Correlation coefficient curve
    Hardware of optical tomography
    Fig. 7. Hardware of optical tomography
    Target image5×3010×3015×3030×3060×30
    Table 1. Reconstructed images obtained by changing number of lasers
    Scene5×3010×3015×3030×3060×30
    Scene 1γ0.19990.21500.21780.21760.0689
    CCC0.95400.96070.96080.96150.9964
    Scene 2γ0.11310.10220.11560.09740.1174
    CCC0.97440.98860.98940.99400.9908
    Scene 3γ0.20580.15010.18240.15530.2086
    CCC0.94120.97230.97390.98480.9667
    Scene 4γ0.25860.22430.24290.24120.2398
    CCC0.94390.96520.96710.96890.9634
    Table 2. Relative image error and image correlation coefficient corresponding to table 1
    Target image30×530×1030×1530×3030×60
    Table 3. Reconstructed images obtained by changing number of photodiodes
    Scene5×3010×3015×3030×3060×30
    Scene 1γ0.21710.21420.21810.21760.1056
    CCC0.94730.95760.96090.96150.9922
    Scene 2γ0.14100.12810.11370.09740.0868
    CCC0.97300.98670.99130.99400.9917
    Scene 3γ0.20770.19380.18310.15530.1665
    CCC0.93460.96830.97600.98480.9763
    Scene 4γ0.24880.21500.24090.24120.2521
    CCC0.94180.96440.96400.96890.9640
    Table 4. Relative image error and image correlation coefficient corresponding to table 3
    SceneTarget imageReconstructed imageγCCC
    Scene 10.21920.9606
    Scene 20.17980.9780
    Scene 30.20230.9623
    Scene 40.16960.9783
    Table 5. Image reconstruction of optical tomography static experiment
    Shanen Yu, Wendong Yang, Huajun Li. Research on the Structure of an Optical Tomography Sensor Based on Numerical Simulations[J]. Laser & Optoelectronics Progress, 2022, 59(22): 2228001
    Download Citation