
Jing Liu, Yue Tian, Jiulun Fan. Image Threshold Segmentation Method Based on Cumulative Residual Information Energy[J]. Laser & Optoelectronics Progress, 2023, 60(16): 1610004
- Laser & Optoelectronics Progress
- Vol. 60, Issue 16, 1610004 (2023)

Fig. 1. Probability distribution function
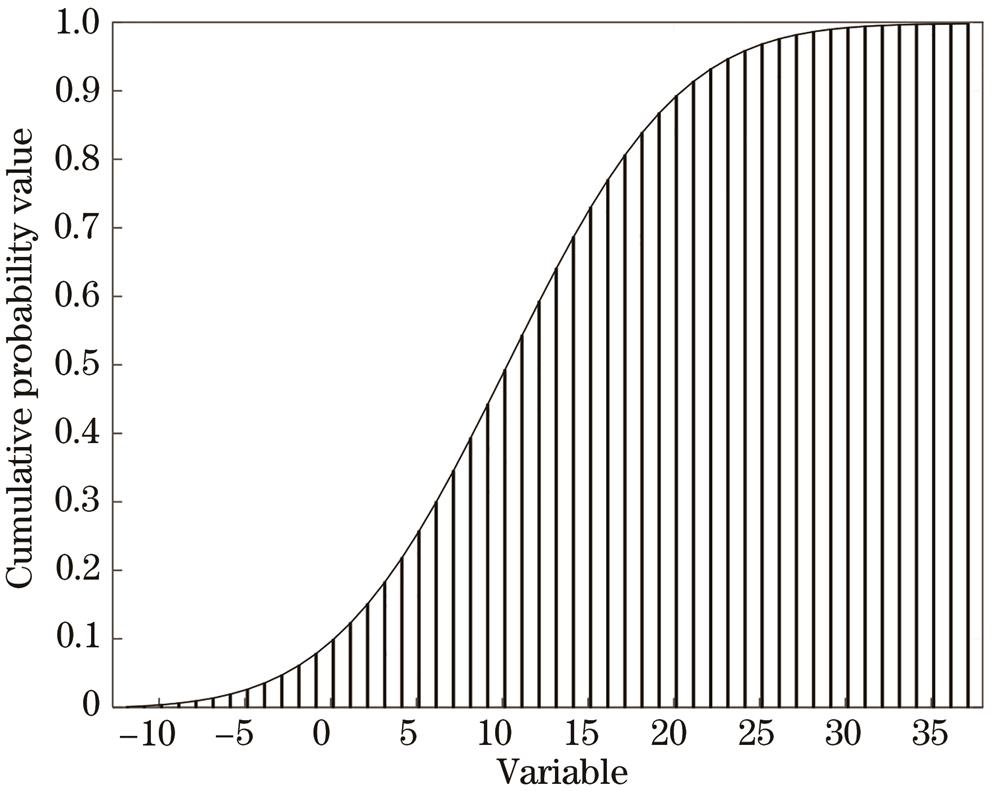
Fig. 2. Cumulative distribution function
Fig. 3. Cumulative residual distribution function
Fig. 4. Cumulative residual information energy function
Fig. 5. Color images of test images. (a) 368016; (b) 135069; (c) 12074; (d) 100007; (e) 238011
Fig. 6. Gray images of test images. (a) 368016; (b) 135069; (c) 12074; (d) 100007; (e) 238011
Fig. 7. Gray histograms of test images. (a) 368016; (b) 135069; (c) 12074; (d) 100007; (e) 238011
Fig. 8. Segmentation results of different methods (#368016). (a) Standard segmentation; (b) method 1; (c) method 2; (d) method 3; (e) method 4; (f) method 5; (g) method 6; (h) method 7
Fig. 9. Segmentation results of different methods (#135069). (a) Standard segmentation; (b) method 1; (c) method 2; (d) method 3; (e) method 4; (f) method 5; (g) method 6; (h) method 7
Fig. 10. Segmentation results of different methods (#12074). (a) Standard segmentation; (b) method 1; (c) method 2; (d) method 3; (e) method 4; (f) method 5; (g) method 6; (h) method 7
Fig. 11. Segmentation results of different methods (#100007). (a) Standard segmentation; (b) method 1; (c) method 2; (d) method 3; (e) method 4; (f) method 5; (g) method 6; (h) method 7
Fig. 12. Segmentation results of different methods (#238011). (a) Standard segmentation; (b) method 1; (c) method 2; (d) method 3; (e) method 4; (f) method 5; (g) method 6; (h) method 7
Fig. 13. Comparison of segmentation accuracy of test images under different methods
Fig. 14. Comparison of peak signal-to-noise ratio of test images under different methods
Fig. 15. Color images of test images. (a) cell1; (b) cell2; (c) cell3
Fig. 16. Gray histograms of test images. (a) cell1; (b) cell 2; (c) cell 3
Fig. 17. Segmentation results of different methods (#cell1). (a) Standard segmentation; (b) method 1; (c) method 2; (d) method 3; (e) method 4; (f) method 5; (g) method 6; (h) method 7
Fig. 18. Segmentation results of different methods (#cell 2). (a) Standard segmentation; (b) method 1; (c) method 2; (d) method 3; (e) method 4; (f) method 5; (g) method 6; (h) method 7
Fig. 19. Segmentation results of different methods (#cell3). (a) Standard segmentation; (b) method 1; (c) method 2; (d) method 3; (e) method 4; (f) method 5; (g) method 6; (h) method 7
|
Table 1. Running time of brute force and recursive algorithm
|
Table 2. Comparison of segmentation accuracy of test images under different methods
|
Table 3. Comparison of peak signal-to-noise ratio of test images under different methods
|
Table 4. Comparison of segmentation accuracy of test images under different methods
|
Table 5. Comparison of peak signal-to-noise ratio of test images under different methods


Set citation alerts for the article
Please enter your email address

© Copyright 2018-2021 | Chinese Laser Press. All Rights Reserved 沪ICP备15018463号-20