• Laser & Optoelectronics Progress
  • Vol. 56, Issue 24, 241201 (2019)
Jinghong Wu1,*, Hao Liu1, Peng Yang2,3, and Na Jiang1
Author Affiliations
  • 1School of Civil Engineering, Suzhou University of Science and Technology, Suzhou, Jiangsu 215011, China
  • 2School of Earth Sciences and Engineering, Nanjing University, Nanjing, Jiangsu 210046, China
  • 3Suzhou NanZee Sensing Technology Co., Ltd., Suzhou, Jiangsu 215123, China
  • show less
    DOI: 10.3788/LOP56.241201 Cite this Article Set citation alerts
    Jinghong Wu, Hao Liu, Peng Yang, Na Jiang. Identification and Monitoring of Concrete Cracks Based on Optical Frequency Domain Reflectometry Technique[J]. Laser & Optoelectronics Progress, 2019, 56(24): 241201 Copy Citation Text show less
    Working principle of OFDR
    Fig. 1. Working principle of OFDR
    Picture of optical cable
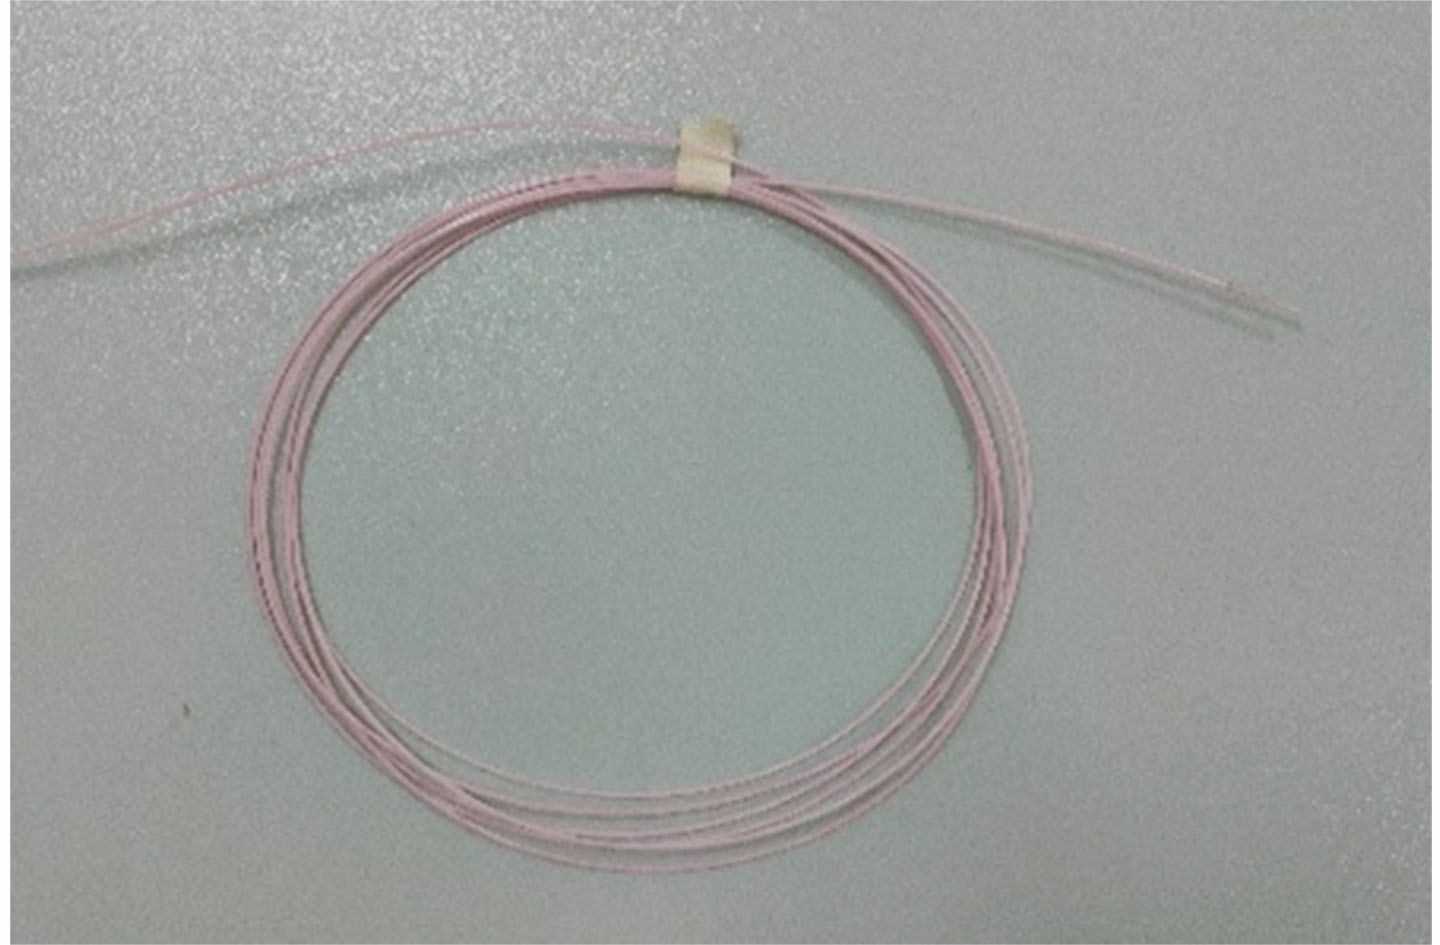
    Fig. 2. Picture of optical cable
    OFDR demodulation instrument
    Fig. 3. OFDR demodulation instrument
    Schematic of fiber arrangement. (a) Before cracking; (b) after cracking
    Fig. 4. Schematic of fiber arrangement. (a) Before cracking; (b) after cracking
    Strain curves. (a) 1 cm spatial resolution; (b) 5 mm spatial resolution; (c) 2 mm spatial resolution
    Fig. 5. Strain curves. (a) 1 cm spatial resolution; (b) 5 mm spatial resolution; (c) 2 mm spatial resolution
    Comparison of monitoring results under three spatial resolutions
    Fig. 6. Comparison of monitoring results under three spatial resolutions
    Comparison of measured and real values of crack width
    Fig. 7. Comparison of measured and real values of crack width
    Experimental scheme. (a) Actual picture; (b) schematic diagram
    Fig. 8. Experimental scheme. (a) Actual picture; (b) schematic diagram
    Cracking diagram of concrete beam bottom
    Fig. 9. Cracking diagram of concrete beam bottom
    Strain of fiber 1 at each loading level
    Fig. 10. Strain of fiber 1 at each loading level
    Strain of fiber 2 at each loading level
    Fig. 11. Strain of fiber 2 at each loading level
    Width of crack 4 at each loading level
    Fig. 12. Width of crack 4 at each loading level
    Pictures of cracks. (a) Crack with 0.10 mm width; (b) crack with 0.22 mm width; (c) crack with 0.34 mm width
    Fig. 13. Pictures of cracks. (a) Crack with 0.10 mm width; (b) crack with 0.22 mm width; (c) crack with 0.34 mm width
    Optical fiber numberL1L2L3L4
    L /cm18.621.037.240.2
    Table 1. Distance to fixed end
    CrackNumberMeasuredposition /mPosition under 1 cmspatial resolutionPosition under 5 mmspatial resolutionPosition under 2 mmspatial resolution
    FirstSecondThirdFirstSecondThirdFirstSecondThird
    13.9503.9503.9503.9503.9503.9503.9503.9523.952-
    24.4624.4604.4604.4604.4604.4604.4604.4604.460-
    34.9634.9604.9604.9604.9654.9654.9654.9644.964-
    45.4505.4505.4505.4505.4505.4455.4505.4505.450-
    Table 2. Comparison of measured crack position data and measurement results of OFDR
    Crack No.Measurement value /mmActual value /mmAbsolute error /mmRelative error /%
    10.1780.180-0.002-1.111
    20.2020.2000.0021.000
    30.2770.280-0.003-1.071
    40.3030.310-0.007-2.258
    50.1660.1600.0063.750
    60.1990.200-0.001-0.500
    70.1790.180-0.001-0.556
    80.2880.2800.0082.857
    90.2380.240-0.002-0.833
    100.1510.160-0.009-5.625
    Table 3. Comparison of actual and measured values of crack widths
    Jinghong Wu, Hao Liu, Peng Yang, Na Jiang. Identification and Monitoring of Concrete Cracks Based on Optical Frequency Domain Reflectometry Technique[J]. Laser & Optoelectronics Progress, 2019, 56(24): 241201
    Download Citation