• Laser & Optoelectronics Progress
  • Vol. 60, Issue 17, 1712005 (2023)
Qizhen Hou, Hao Wang*, and Huiying Duan
Author Affiliations
  • College of Electronic Information and Automation, Civil Aviation University of China, Tianjin 300300, China
  • show less
    DOI: 10.3788/LOP222535 Cite this Article Set citation alerts
    Qizhen Hou, Hao Wang, Huiying Duan. Near-Field Detection Method for Light Intensity Based on Fourier Series Fitting[J]. Laser & Optoelectronics Progress, 2023, 60(17): 1712005 Copy Citation Text show less
    Process of light intensity detection
    Fig. 1. Process of light intensity detection
    Comparison of interpolation methods. (a) Real curve and random points; (b) Pchip; (c) Linear; (d) Spline; (e) Polynomial; (f) Fourier
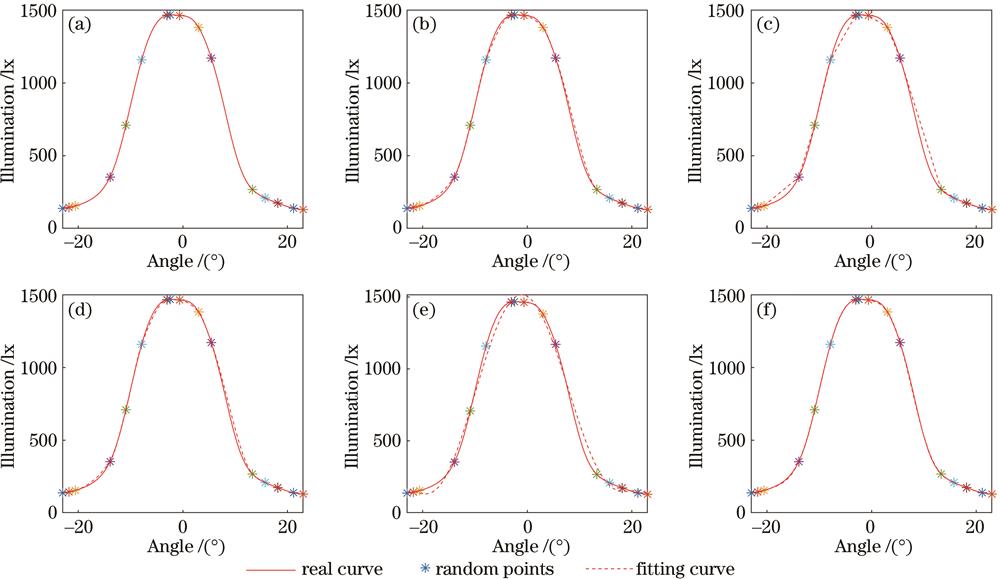
    Fig. 2. Comparison of interpolation methods. (a) Real curve and random points; (b) Pchip; (c) Linear; (d) Spline; (e) Polynomial; (f) Fourier
    Improvement of Fourier series fitting algorithm. (a) Traditional fitting algorithm; (b) variance of each point; (c) curve form; (d) improved Fourier series fitting algorithm
    Fig. 3. Improvement of Fourier series fitting algorithm. (a) Traditional fitting algorithm; (b) variance of each point; (c) curve form; (d) improved Fourier series fitting algorithm
    Images at different detection distances. (a) >r; (b) <r
    Fig. 4. Images at different detection distances. (a) >r; (b) <r
    Typical configurations of navigation lights. (a) Rectangular array; (b) circular array; (c) line-shaped array; (d) wing-shaped array; (e) X-shaped array
    Fig. 5. Typical configurations of navigation lights. (a) Rectangular array; (b) circular array; (c) line-shaped array; (d) wing-shaped array; (e) X-shaped array
    Result of image processing
    Fig. 6. Result of image processing
    Light intensity distributions of single LED light source. (a) True light intensity distribution; (b) light intensity distribution of first fitting
    Fig. 7. Light intensity distributions of single LED light source. (a) True light intensity distribution; (b) light intensity distribution of first fitting
    Comparison of calculation results. (a) True light intensity distribution; (b) light intensity distribution of primal algorithm; (c) light intensity distribution of improved algorithm
    Fig. 8. Comparison of calculation results. (a) True light intensity distribution; (b) light intensity distribution of primal algorithm; (c) light intensity distribution of improved algorithm
    Detection results of five arrays. (a) True light intensity distribution; (b) Wea; (c) Bri; (d) In10; (e) In30; (f) Des
    Fig. 9. Detection results of five arrays. (a) True light intensity distribution; (b) Wea; (c) Bri; (d) In10; (e) In30; (f) Des
    Evaluation criterionPchipLinearSplinePolynomialFourier
    RMSE15.478840.764115.908643.43983.8321
    Table 1. Errors of different fitting methods
    MethodNameMatched-degree /%NameMatched-degree /%NameMatched-degree /%
    BfLED195.3634LED295.5262LED395.2363
    BfLED495.1808LED595.2065LED695.3287
    BfLED795.5226LED895.5019LED995.6118
    BfLED1094.8458LED1194.9159LED1295.8700
    BfLED1394.7419LED1495.4204LED1595.2305
    BfLED1695.3509
    AfLED195.6917LED296.2803LED395.7017
    AfLED495.8231LED596.3546LED696.3257
    AfLED796.2638LED896.5252LED996.4384
    AfLED1095.9027LED1196.2491LED1296.3910
    AfLED1396.0759LED1495.8049LED1595.6712
    AfLED1695.9833
    Table 2. Matched-degrees calculated by two algorithms
    StateMatched-degreeRectangular array /%Circular array /%Line-shaped array /%Wing-shaped array /%X-shaped array /%
    NorMaximum96.525296.278996.132896.705096.0229
    NorMinimum95.671194.800795.532795.040995.1517
    WeaFault light95.693995.779395.056495.394694.8819
    WeaMaximum96.502296.301896.240396.758296.5447
    WeaMinimum95.680294.794995.056495.064094.2362
    BriFault light95.652495.746595.746595.753894.6311
    BriMaximum96.449396.017796.017896.753896.4775
    BriMinimum95.649995.192595.192595.032494.8414
    In10Fault light94.809892.357593.329694.535992.5587
    In10Maximum96.648795.774795.841696.624796.4892
    In10Minimum94.809892.357593.329694.535992.5587
    In30Fault light90.931890.363590.058190.040490.5622
    In30Maximum95.605395.689095.756697.146295.8768
    In30Minimum90.931890.363590.058190.040490.5622
    Table 3. Matched-degrees of five arrays
    StateEvaluation criterionRectangular arrayCircular arrayLine-shaped arrayWing-shaped arrayX-shaped array
    DesRMSE1988.00092289.39942289.3994596.30853904.1982
    DesMAXF /lx643.54431195.72841374.3856398.6711406.0723
    DesAVGF /lx92.960365.399566.620716.139019.6735
    DesMAXN /lx29366.464429324.800029222.800029718.700029680.2000
    DesAVGN /lx1001.98781103.30101109.4476493.6655653.3582
    Table 4. Matched-degrees of Des
    Qizhen Hou, Hao Wang, Huiying Duan. Near-Field Detection Method for Light Intensity Based on Fourier Series Fitting[J]. Laser & Optoelectronics Progress, 2023, 60(17): 1712005
    Download Citation