• Acta Photonica Sinica
  • Vol. 53, Issue 11, 1131002 (2024)
Ming TANG1,2, Shuang LU1,3, Zhanglin HU1,2, Shuhui LI1,2..., Chao YUN1,2, Yinzhuo HU1,2, Jie CHEN1,3, Wenbin LI1,2,* and Zhanshan WANG1,2,**|Show fewer author(s)
Author Affiliations
  • 1Nanophononics MOE Key Laboratory of Advanced Micro-Structured Materials,Shanghai 200092,China
  • 2Institute of Precision Optical Engineering,School of Physics Science and Engineering,Tongji University,Shanghai 200092,China
  • 3Center for Phononics and Thermal Energy Science,China-EU Joint Lab for Nanophononics MOE Key Laboratory of Advanced Micro-structured Materials,School of Physics Science and Engineering,Tongji University,Shanghai 200092,China
  • show less
    DOI: 10.3788/gzxb20245311.1131002 Cite this Article
    Ming TANG, Shuang LU, Zhanglin HU, Shuhui LI, Chao YUN, Yinzhuo HU, Jie CHEN, Wenbin LI, Zhanshan WANG. Molecular Dynamics Study of the Temperature Effects on Damage Mechanisms of Ni Films Irradiated by Extreme Ultraviolet Free-electron Laser[J]. Acta Photonica Sinica, 2024, 53(11): 1131002 Copy Citation Text show less
    Model diagram of TTM-MD method
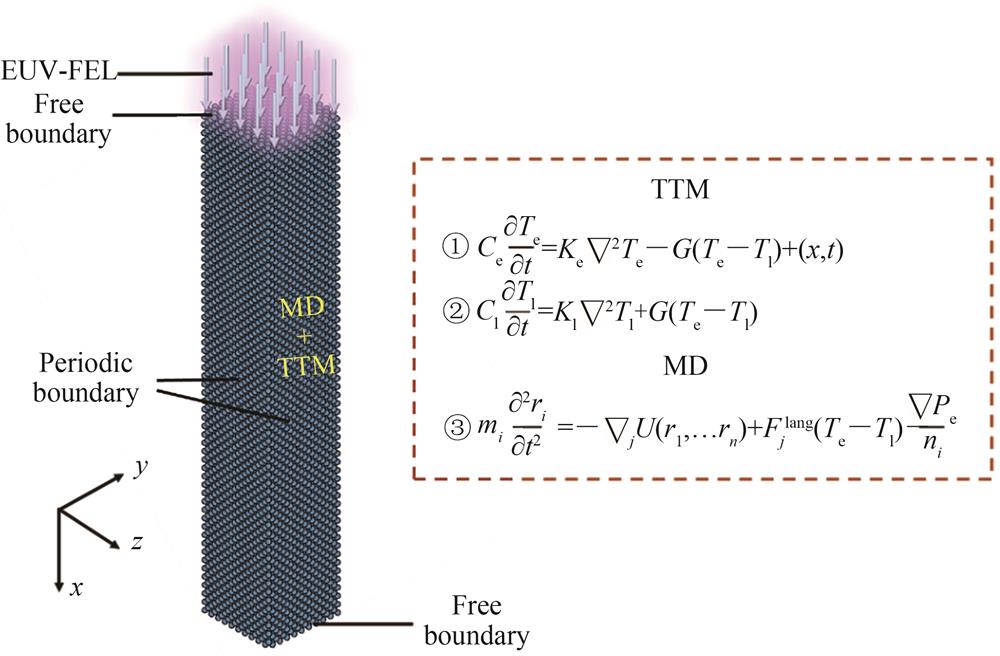
    Fig. 1. Model diagram of TTM-MD method
    The relationship between the melting threshold and the initial temperature of Ni films (50 nm),the dashed line represents the extension of the fitted solid line
    Fig. 2. The relationship between the melting threshold and the initial temperature of Ni films (50 nm),the dashed line represents the extension of the fitted solid line
    Atomic snapshots at 19 ps for initial temperatures of 300 K,900 K,and 1 300 K with red marked atoms in a molten state and dark blue marked atoms in a crystalline state
    Fig. 3. Atomic snapshots at 19 ps for initial temperatures of 300 K,900 K,and 1 300 K with red marked atoms in a molten state and dark blue marked atoms in a crystalline state
    The temperature distribution diagram of Ni film (50 nm) at different initial temperature when melting damage occurs,the purple marked area represents the melting area
    Fig. 4. The temperature distribution diagram of Ni film (50 nm) at different initial temperature when melting damage occurs,the purple marked area represents the melting area
    The stress distribution diagram of Ni film (50 nm) at different initial temperature when melting damage occurs,the purple marked area represents the melting area
    Fig. 5. The stress distribution diagram of Ni film (50 nm) at different initial temperature when melting damage occurs,the purple marked area represents the melting area
    Initial temperature of Ni filmT/TmAverage heating rate (×1013 K·s-1
    300 K1.064.4
    500 K1.063.5
    700 K1.052.8
    900 K1.041.8
    1 100 K/0.6
    1 300 K/0.5
    Table 0. The overheating ratio of the homogeneous nucleation region at different initial temperatures and the average heating rate in the middle (24~26 nm) region of the film
    ParameterSymbolValueReference
    FEL pulse widthτp200 fs
    FEL wavelengthλ13.5 nm
    Electronic thermal conductivityKeKe=K0Te/TlK0=91 W/m/K43
    Electronic heat capacityCeCe=γTeγ=1 065 J/m3/K243
    Penetration depthδ2.88 nm44
    Electron-phonon coupling constantG3.6×1017 W/m3/K-143
    Blast force constantB0.66738
    Electronic mean free pathλe13.3 nm45
    Table 0. Simulation parameters of TTM-MD
    Ming TANG, Shuang LU, Zhanglin HU, Shuhui LI, Chao YUN, Yinzhuo HU, Jie CHEN, Wenbin LI, Zhanshan WANG. Molecular Dynamics Study of the Temperature Effects on Damage Mechanisms of Ni Films Irradiated by Extreme Ultraviolet Free-electron Laser[J]. Acta Photonica Sinica, 2024, 53(11): 1131002
    Download Citation