Teng MA1,2, Yuejing GE3,4, Yu HUANG5, Xiaofeng LIU6..., Rongping LIN7 and Zhiding HU2|Show fewer author(s)
Author Affiliations
1School of Economics and Management, Hangzhou Normal University, Hangzhou 311121, China2Institute for Global Innovation and Development, East China Normal University, Shanghai 200062, China3Faculty of Geographical Science, Beijing Normal University, Beijing 100875, China4Academy of Plateau Science and Sustainability, Xining 810008, China5Key Laboratory of Alpine Ecology, Institute of Tibetan Plateau Research, CAS, Beijing 1001016Department of Geography, The University of Hong Kong, Hong Kong 999077, China7School of Geography and Planning, Sun Yat-sen University, Guangzhou 510275, Chinashow less
DOI: 10.11821/dlxb202010004
Cite this Article
Teng MA, Yuejing GE, Yu HUANG, Xiaofeng LIU, Rongping LIN, Zhiding HU. Geo-economic relations of China and the US in Northeast Asia: An analysis based on flow data[J]. Acta Geographica Sinica, 2020, 75(10): 2076
Copy Citation Text
show less
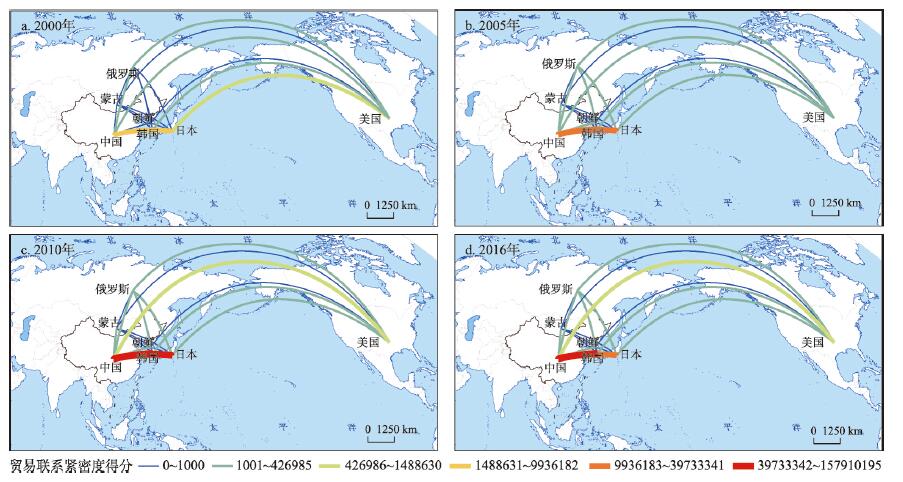
Fig. 1. The spatio-temporal evolution of the trade tightness between Northeast Asian countries in 2000-2016
Fig. 2. The spatio-temporal evolution of the investment tightness between Northeast Asian countries in 2004-2016
Fig. 3. Trade streaming potentials of China with Northeast Asian countries in 2004-2016
Fig. 4. Investment streaming potentials of China with Northeast Asian countries in 2004-2016
Fig. 5. Geo-economic streaming potentials of China with Northeast Asian countries in 2004-2016
Fig. 6. Trade streaming potential of the US with Northeast Asian countries in 2004-2016
Fig. 7. Investment streaming potentials of the US with Northeast Asian countries in 2004-2016
Fig. 8. Geo-economic streaming potentials of the US with Northeast Asian countries 2004-2016
Fig. 9. Comparison of the geo-economic streaming potentials of China and the US with Northeast Asian countries in 2004-2016
| 市场开放程度 | 包含国家 | 加入WTO时间 | 赋值 |
|---|
| 非常开放 | 美国 | 1994 | 5 | | 比较开放 | 日本 | 1994 | 4 | | 韩国 | 1994 | | 一般开放 | 蒙古 | 1997 | 3 | | 中国 | 2001 | | 比较封闭 | 俄罗斯 | 2012 | 2 | | 非常封闭 | 朝鲜 | 未加入 | 1 |
|
Table 1. Likert scale of market exposure of Northeast Asian countries
| 年份 | GeoT中日 | GeoT中韩 | GeoT中俄 | GeoT中蒙 | GeoT中美 | GeoT中朝 |
|---|
| 2004 | 0.198653 | 0.063552 | 0.015417 | 0.001566 | 0.259292 | 0.002868 | | 2005 | 0.216795 | 0.075297 | 0.018969 | 0.001725 | 0.330009 | 0.003151 | | 2006 | 0.222676 | 0.086995 | 0.020029 | 0.00185 | 0.403782 | 0.003137 | | 2007 | 0.257802 | 0.123021 | 0.031677 | 0.002348 | 0.484522 | 0.003482 | | 2008 | 0.292919 | 0.177031 | 0.035691 | 0.002625 | 0.520465 | 0.004249 | | 2009 | 0.255971 | 0.136953 | 0.022546 | 0.003123 | 0.482747 | 0.004485 | | 2010 | 0.325962 | 0.18804 | 0.033208 | 0.003555 | 0.644983 | 0.004821 | | 2011 | 0.387919 | 0.218801 | 0.041927 | 0.004724 | 0.721979 | 0.005548 | | 2012 | 0.375531 | 0.224483 | 0.045527 | 0.004349 | 0.774254 | 0.005599 | | 2013 | 0.285369 | 0.23043 | 0.043764 | 0.004035 | 0.6051 | 0.00555 | | 2014 | 0.284758 | 0.257787 | 0.049055 | 0.003884 | 0.663472 | 0.00553 | | 2015 | 0.323001 | 0.352887 | 0.041384 | 0.003476 | 0.773953 | 0.005819 | | 2016 | 0.49729 | 0.387959 | 0.061649 | 0.009182 | 0.922725 | 0.011615 |
|
Table 2. Measurement result of trade streaming potential of China with Northeast Asian countries in 2004-2016
| 年份 | GeoI中日 | GeoI中韩 | GeoI中俄 | GeoI中蒙 | GeoI中美 | GeoI中朝 |
|---|
| 2004 | 0.158649 | 0.178929 | 0.087951 | 0.145102 | 0.134625 | 0.043586 | | 2005 | 0.173257 | 0.179049 | 0.088566 | 0.145273 | 0.148514 | 0.043241 | | 2006 | 0.171622 | 0.17793 | 0.089425 | 0.145847 | 0.149631 | 0.04444 | | 2007 | 0.171806 | 0.178687 | 0.098073 | 0.146703 | 0.151387 | 0.046355 | | 2008 | 0.179543 | 0.176713 | 0.098917 | 0.147642 | 0.153293 | 0.048775 | | 2009 | 0.180754 | 0.195692 | 0.099659 | 0.148709 | 0.16881 | 0.049762 | | 2010 | 0.182322 | 0.193295 | 0.1078 | 0.149303 | 0.174384 | 0.05216 | | 2011 | 0.194361 | 0.278586 | 0.109854 | 0.150678 | 0.186676 | 0.059351 | | 2012 | 0.19652 | 0.381083 | 0.112196 | 0.158648 | 0.222806 | 0.060461 | | 2013 | 0.202185 | 0.372649 | 0.154419 | 0.165132 | 0.249994 | 0.064399 | | 2014 | 0.201621 | 0.381019 | 0.162381 | 0.166427 | 0.295461 | 0.068422 | | 2015 | 0.201315 | 0.388224 | 0.182308 | 0.203822 | 0.302189 | 0.070722 | | 2016 | 0.201764 | 0.394079 | 0.179638 | 0.204127 | 0.352566 | 0.072224 |
|
Table 3. Measurement result of investment streaming potential of China with Northeast Asian countries in 2004-2016
| 年份 | GeoE中日 | GeoE中韩 | GeoE中俄 | GeoE中蒙 | GeoE中美 | GeoE中朝 |
|---|
| 2004 | 0.031516 | 0.011371 | 0.001356 | 0.000227 | 0.034907 | 0.000125 | | 2005 | 0.037561 | 0.013482 | 0.00168 | 0.000251 | 0.049011 | 0.000136 | | 2006 | 0.038216 | 0.015479 | 0.001791 | 0.00027 | 0.060418 | 0.000139 | | 2007 | 0.044292 | 0.021982 | 0.003107 | 0.000344 | 0.07335 | 0.000161 | | 2008 | 0.052592 | 0.031284 | 0.00353 | 0.000387 | 0.079784 | 0.000207 | | 2009 | 0.046268 | 0.026801 | 0.002247 | 0.000464 | 0.081492 | 0.000223 | | 2010 | 0.05943 | 0.036347 | 0.00358 | 0.000531 | 0.112475 | 0.000251 | | 2011 | 0.075396 | 0.060955 | 0.004606 | 0.000712 | 0.134776 | 0.000329 | | 2012 | 0.0738 | 0.085547 | 0.005108 | 0.00069 | 0.172508 | 0.000339 | | 2013 | 0.057697 | 0.085869 | 0.006758 | 0.000666 | 0.151271 | 0.000357 | | 2014 | 0.057413 | 0.098222 | 0.007966 | 0.000646 | 0.19603 | 0.000378 | | 2015 | 0.065025 | 0.136999 | 0.007545 | 0.000709 | 0.233881 | 0.000412 | | 2016 | 0.100335 | 0.152886 | 0.011075 | 0.001874 | 0.325321 | 0.000839 |
|
Table 4. Measurement result of geo-economic streaming potentials of China with Northeast Asian countries in 2004-2016