• Laser & Optoelectronics Progress
  • Vol. 60, Issue 15, 1506002 (2023)
Ling Ju1,*, Beibei Weng1, Xiling Niu2, Chuanlu Deng2, and Yi Huang2
Author Affiliations
  • 1State Grid Jiangsu Electric Power Co., Ltd., Taizhou Power Supply Company, Taizhou 225300, Jiangsu, China
  • 2Key Laboratory of Specialty Fiber Optics and Optical Access Networks, Shanghai University, Shanghai 200444, China
  • show less
    DOI: 10.3788/LOP221726 Cite this Article Set citation alerts
    Ling Ju, Beibei Weng, Xiling Niu, Chuanlu Deng, Yi Huang. Ultrasonic Detection Based on Diaphragm Optical Fiber Fabry-Perot Sensor[J]. Laser & Optoelectronics Progress, 2023, 60(15): 1506002 Copy Citation Text show less
    Schematic diagram of optical fiber Fabry-Perot(F-P) sensor
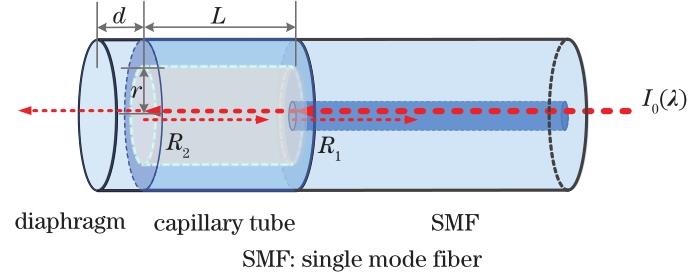
    Fig. 1. Schematic diagram of optical fiber Fabry-Perot(F-P) sensor
    Sensing mechanism diagram of optical fiber F-P cavity acoustic sensor
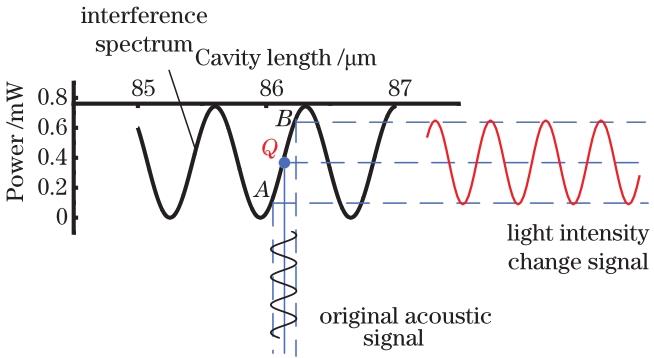
    Fig. 2. Sensing mechanism diagram of optical fiber F-P cavity acoustic sensor
    Establishment of simulated acoustic field. (a) 3D simulation model of acoustic field and diaphragm; (b) changes in position of acoustic source relative to diaphragm
    Fig. 3. Establishment of simulated acoustic field. (a) 3D simulation model of acoustic field and diaphragm; (b) changes in position of acoustic source relative to diaphragm
    Relation between deformation of diaphragm and distance. (a) Deformation of diaphragm at different distances; (b) relation between maximum deformation of diaphragm and distance
    Fig. 4. Relation between deformation of diaphragm and distance. (a) Deformation of diaphragm at different distances; (b) relation between maximum deformation of diaphragm and distance
    Relation between deformation of diaphragm and angle. (a) Deformation of diaphragm at different angles; (b) relation between maximum deformation of diaphragm and angle
    Fig. 5. Relation between deformation of diaphragm and angle. (a) Deformation of diaphragm at different angles; (b) relation between maximum deformation of diaphragm and angle
    Schematic diagram of sensor preparation process. (a) Welding for the first time; (b) cutting for the first time; (c) welding for the second time; (d) cutting for the second time; (e) polishing
    Fig. 6. Schematic diagram of sensor preparation process. (a) Welding for the first time; (b) cutting for the first time; (c) welding for the second time; (d) cutting for the second time; (e) polishing
    Images of sensor and its spectra before and after polishing. (a) Images of sensor before and after polishing; (b) spectra of sensor before and after polishing
    Fig. 7. Images of sensor and its spectra before and after polishing. (a) Images of sensor before and after polishing; (b) spectra of sensor before and after polishing
    Schematic diagram of optical fiber F-P ultrasonic sensing system
    Fig. 8. Schematic diagram of optical fiber F-P ultrasonic sensing system
    Time-domain and frequency-domain signals of 20, 40, and 60 kHz
    Fig. 9. Time-domain and frequency-domain signals of 20, 40, and 60 kHz
    Frequency response range of F-P ultrasonic sensor
    Fig. 10. Frequency response range of F-P ultrasonic sensor
    Working point position of each sensor sample
    Fig. 11. Working point position of each sensor sample
    Influence of distance and angle on sensing effect. (a) SNR at different distances; (b) SNR at different angles
    Fig. 12. Influence of distance and angle on sensing effect. (a) SNR at different distances; (b) SNR at different angles
    GIS partial discharge simulation device
    Fig. 13. GIS partial discharge simulation device
    Partial discharge detection results of F-P sensor and current transformer (CT). (a) 4.7 kV voltage is applied;(b) 5.1 kV voltage is applied
    Fig. 14. Partial discharge detection results of F-P sensor and current transformer (CT). (a) 4.7 kV voltage is applied;(b) 5.1 kV voltage is applied
    Sample No.Cavity length LInitial film thickness d0Polishing thickness dp
    190.8231.6524.08
    294.9538.5327.52

    3

    4

    5

    83.94

    85.32

    85.32

    116.97

    63.30

    59.17

    30.27

    30.96

    28.90

    Table 1. Sample parameters
    ReferenceDiaphragm material

    Diaphragm size

    effective radius/thickness

    SensitivityFabrication method(difficulty)
    12Graphene62.5 μm/4.615 nm2.38 nm/PaGraphene separation and transfer(hard)
    14Gold1.25 mm/300 nm0.279 nm/PaElectron beam vapor deposition method(hard)
    25Silk fibroin63.5 μm/20 μm0.0123 nm/PaChemical generation(hard)
    ProposedQuartz37.5 μm/24 μm0.0424 nm/PaOptical fiber processing(easy)
    Table 2. Comparison of performance indexes of optical fiber acoustic sensor
    Ling Ju, Beibei Weng, Xiling Niu, Chuanlu Deng, Yi Huang. Ultrasonic Detection Based on Diaphragm Optical Fiber Fabry-Perot Sensor[J]. Laser & Optoelectronics Progress, 2023, 60(15): 1506002
    Download Citation