• Optics and Precision Engineering
  • Vol. 30, Issue 12, 1462 (2022)
Linfeng ZHOU1,*, Guoqiang FU1,2,3, Zhengtang LI4, Guoqiang LEI1, and Xiaolei DENG5
Author Affiliations
  • 1School of Mechanical Engineering, Southwest Jiaotong University, Chengdu6003, China
  • 2State Key Laboratory of Fluid Power and Mechatronics, Zhejiang University, Hangzhou31007, China
  • 3School of Mechanical Engineering, Sichuan University, Chengdu610065, China
  • 4Chongqing Well Primus Technology Research Institute Co. Ltd., Chongqing00050, China
  • 5Key Laboratory of Air-driven Equipment Technology of Zhejiang Province, Quzhou University, Quzhou324000, China
  • show less
    DOI: 10.37188/OPE.20223012.1462 Cite this Article
    Linfeng ZHOU, Guoqiang FU, Zhengtang LI, Guoqiang LEI, Xiaolei DENG. General-purpose temperature sensitive point combination selection for thermal error of machine tool spindle[J]. Optics and Precision Engineering, 2022, 30(12): 1462 Copy Citation Text show less
    Structure diagram of BP neural network
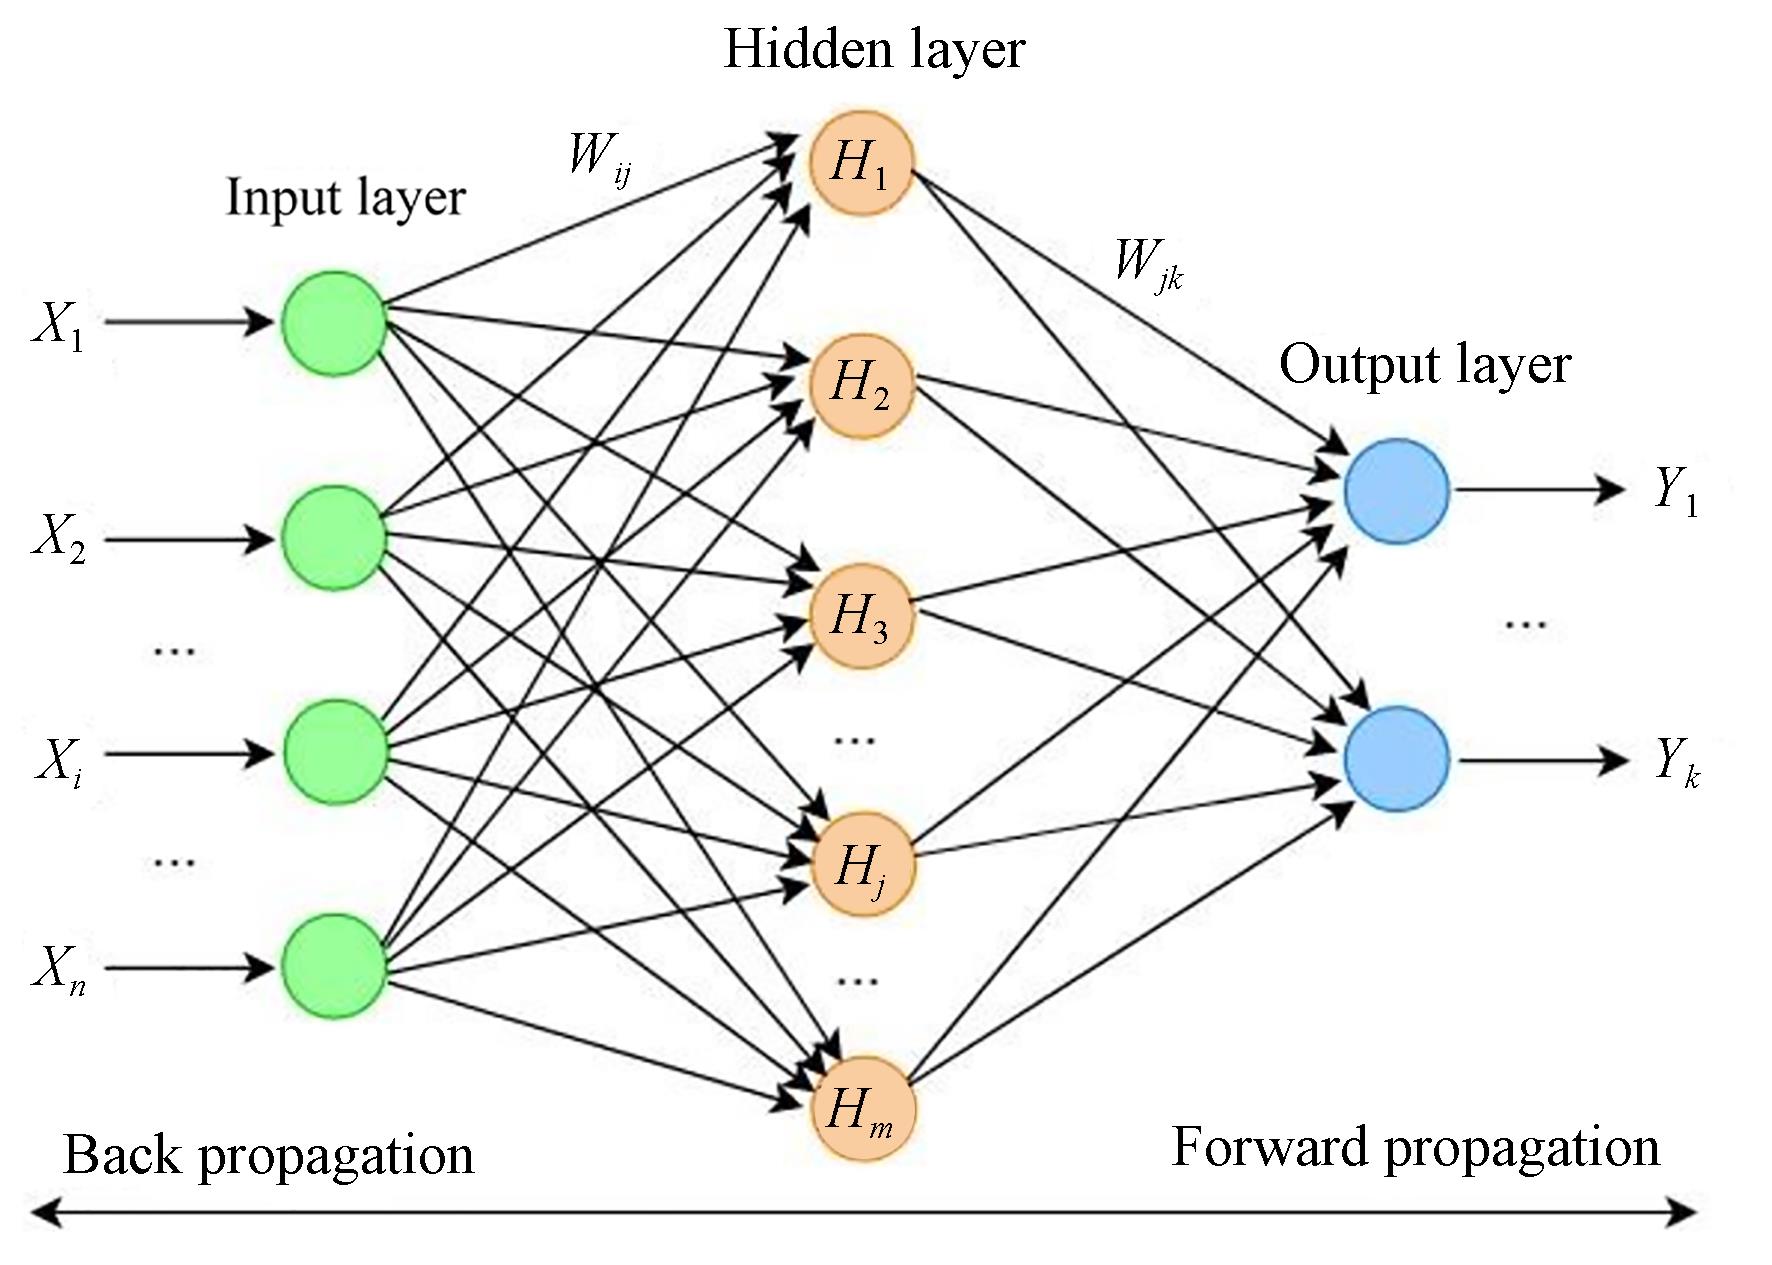
    Fig. 1. Structure diagram of BP neural network
    VMC850 machining center test site
    Fig. 2. VMC850 machining center test site
    Sensor location
    Fig. 3. Sensor location
    Partial temperature data and thermal deformation at 2 500 r/min
    Fig. 4. Partial temperature data and thermal deformation at 2 500 r/min
    Flow chart of comprehensive selection method for optimal temperature sensitive points
    Fig. 5. Flow chart of comprehensive selection method for optimal temperature sensitive points
    Thermal error residual curve of X2 corresponding to different K values at 2 500 r/min
    Fig. 6. Thermal error residual curve of X2 corresponding to different K values at 2 500 r/min
    Prediction performance evaluation results of various thermal errors of BP model
    Fig. 7. Prediction performance evaluation results of various thermal errors of BP model
    Thermal error prediction residual of X1 corresponding to part of K values at 2 500 r/min
    Fig. 8. Thermal error prediction residual of X1 corresponding to part of K values at 2 500 r/min
    Thermal error prediction result of Z corresponding to the combination of different temperature sensitive points at 2 000 r/min
    Fig. 9. Thermal error prediction result of Z corresponding to the combination of different temperature sensitive points at 2 000 r/min
    Prediction residual of thermal error of Z corresponding to part temperature sensitive points combination at 3 000 r/min
    Fig. 10. Prediction residual of thermal error of Z corresponding to part temperature sensitive points combination at 3 000 r/min
    Prediction residual of part temperature sensitive point combination corresponding to thermal error of Z at 5 000 r/min
    Fig. 11. Prediction residual of part temperature sensitive point combination corresponding to thermal error of Z at 5 000 r/min
    Thermal error predictive results of thermal error of Z of RBF model corresponding to part of sensitive temperature points at 2 500 r/min
    Fig. 12. Thermal error predictive results of thermal error of Z of RBF model corresponding to part of sensitive temperature points at 2 500 r/min
    Thermal error predictive results of thermal error of Z of SVM model corresponding to part of sensitive temperature points at 2 500 r/min
    Fig. 13. Thermal error predictive results of thermal error of Z of SVM model corresponding to part of sensitive temperature points at 2 500 r/min
    Thermal error predictive results of thermal error of Z of MLR model corresponding to part of sensitive temperature points at 2 500 r/min
    Fig. 14. Thermal error predictive results of thermal error of Z of MLR model corresponding to part of sensitive temperature points at 2 500 r/min
    位置温度传感器标号
    主轴T1,T2,T3,T4,T5,T6
    主轴箱T7,T9,T10,T11,T12,T13,T20,T21,T22,T27
    箱体两侧T23,T28
    箱体后侧T15,T17,T24
    工作台T14,T16,T18,T19,T25,T26,T29
    环境温度T8
    Table 1. Specific distribution of temperature sensors
    实验编号主轴转速/(r·min-1采集时间/min
    A组2 000430
    B组2 500210
    C组3 000210
    D组5 000195
    Table 2. Design of thermal error experimental conditions
    温度R¯温度R¯温度R¯温度R¯温度R¯
    T10.648 9T70.637 4T130.638 1T190.672 5T250.656 4
    T20.648 8T80.642 8T140.634 4T200.644 3T260.687 6
    T30.648 7T90.635 4T150.674 6T210.640 0T270.643 0
    T40.648 7T100.643 0T160.649 8T220.648 8T280.646 7
    T50.648 7T110.640 7T170.647 0T230.585 9T290.645 6
    T60.648 7T120.642 1T180.676 9T240.644 9
    Table 3. Absolute average correlation coefficient of temperature and thermal error data at 2 500 r/min speed
    K聚类结果
    3{T8,T14,T25},{T15~T21,T23,T24,T26,T28, T29},{T1~T7,T9~T13,T22, T27}
    4{T4},{T8,T18,T25,T26,T29},{T15~T17,T19~T21,T23,T24,T28},{T1~T7,T9~T13,T22,T27}
    5{T15~T19,T24,T28},{T8,T25,T26,T29},{T7,T9,T11,T20,T21,T23},{T1~T6,T10,T12,T13,T22,T27},{T14}
    6{T26,T29},{T8,T25},{T7,T9,T11,T20,T21,T23},{T1~T6,T10,T12,T13,T22,T27},{T14},{T15~T19,T24,T28}
    7{T26,T29},{T8,T25},{T15,T17},{T1~T6,T10,T12,T13,T22,T27},{T14},{T16,T18,T19,T24,T28},{T7,T9,T11,T20,T21,T23}
    8{T26,T29},{T8,T25},{T15,T17},{T1~T7,T9~T13,T27},{T14},{T16,T18,T19,T24,T28},{T20,T21,T23},{T22}
    9{T26,T29},{T8,T25},{T15,T17},{T1~T6,T10,T12,T13,T27},{T14},{T16,T18,T19,T24,T28},{T21,T23},{T22},{T7,T9,T11,T20}
    Table 4. Clustering results of temperature variables corresponding to different K values
    K温度敏感点组合
    3T26,T25,T15
    4T26,T25,T15,T1
    5T26,T25,T15,T1,T14
    6T26,T25,T15,T1,T14,T18
    7T26,T25,T15,T1,T14,T18,T21
    8T26,T25,T15,T1,T14,T18,T21,T22
    9T26,T25,T15,T1,T14,T18,T21,T22,T20
    Table 5. Combination of temperature sensitive points corresponding to different K values at 2 500 r/min speed
    KASAM
    32.7962.855
    42.6422.677
    52.6572.693
    62.6512.689
    72.7802.829
    82.7582.808
    92.6732.711
    Table 6. Absolute residual and absolute root mean square deviation calculation results
    KMS
    30.1610.129
    40.0880.075
    50.1490.122
    60.1160.094
    70.1360.112
    80.2270.162
    90.1210.099
    Table 7. Prediction performance evaluation results of thermal error of X1
    KMS
    31.6671.475
    40.1490.122
    51.8441.615
    61.0890.911
    70.2810.202
    81.0350.876
    90.2520.204
    Table 8. Evaluation results of different K values of thermal error of Z at 2 000 r/min
    KMS
    30.2540.231
    40.1290.107
    50.2170.200
    60.2050.188
    70.1550.139
    80.2680.247
    90.1730.157
    Table 9. Evaluation results of different K values of Z directions at 3 000 r/min
    KMS
    30.2140.184
    40.1570.137
    50.5760.555
    60.6240.598
    70.4830.472
    80.3990.349
    90.4650.444
    Table 10. Evaluation results of different K values of thermal error of Z at 5 000 r/min
    KMS
    31.8241.625
    40.3570.323
    50.4500.352
    60.5190.391
    70.5180.412
    80.7790.689
    90.8170.704
    Table 11. Evaluation results of RBF model prediction performance corresponding to different K values at 2 500 r/min
    KMS
    33.7333.427
    40.6430.506
    50.6430.522
    61.0010.852
    71.1370.962
    81.4111.222
    91.7961.554
    Table 12. Evaluation results of SVM model prediction performance corresponding to different K values at 2 500 r/min
    KMS
    33.8183.521
    40.1570.123
    50.2380.197
    60.2300.188
    70.2430.201
    80.3730.300
    90.5280.439
    Table 13. Evaluation results of SVM model prediction performance corresponding to different K values at 2 500 r/min
    Linfeng ZHOU, Guoqiang FU, Zhengtang LI, Guoqiang LEI, Xiaolei DENG. General-purpose temperature sensitive point combination selection for thermal error of machine tool spindle[J]. Optics and Precision Engineering, 2022, 30(12): 1462
    Download Citation