• Laser & Optoelectronics Progress
  • Vol. 60, Issue 12, 1210010 (2023)
Xiaochuan Li1,2, Guihua Liu1,2,*, Ling Cao1,2, and Lei Deng1,2
Author Affiliations
  • 1School of Information Engineering, Southwest University of Science and Technology, Mianyang 621010, Sichuan, China
  • 2Robot Technology Used for Special Environment Key Laboratory of Sichuan Province, Mianyang 621010, Sichuan, China
  • show less
    DOI: 10.3788/LOP221212 Cite this Article Set citation alerts
    Xiaochuan Li, Guihua Liu, Ling Cao, Lei Deng. Restoration Algorithm for Honeycomb Artifacts Based on Optical Fiber Imaging[J]. Laser & Optoelectronics Progress, 2023, 60(12): 1210010 Copy Citation Text show less
    Imaging optical fiber bundle. (a) Schematic of the overall structure; (b) schematic of monofilament optical fiber structure
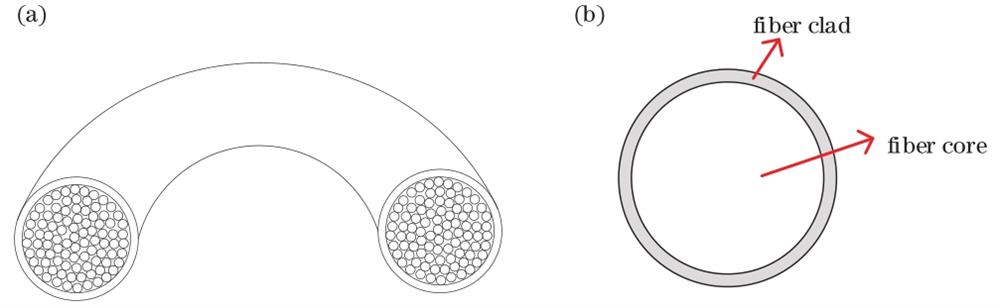
    Fig. 1. Imaging optical fiber bundle. (a) Schematic of the overall structure; (b) schematic of monofilament optical fiber structure
    Optical fiber image beam imaging. (a) Imaging image; (b) pixel distribution
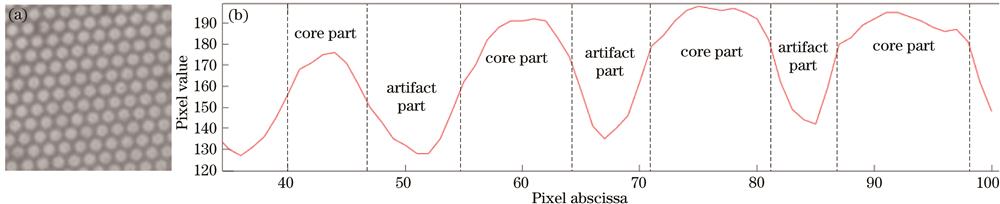
    Fig. 2. Optical fiber image beam imaging. (a) Imaging image; (b) pixel distribution
    Schematic of proposed algorithm structure
    Fig. 3. Schematic of proposed algorithm structure
    Schematic diagram of image split
    Fig. 4. Schematic diagram of image split
    Pixel value distribution before and after split
    Fig. 5. Pixel value distribution before and after split
    Comparison of pixel value distribution before and after processing
    Fig. 6. Comparison of pixel value distribution before and after processing
    Effect after adding honeycomb artifacts. (a) Clean image captured by industrial camera; (b) interference image obtained by simulation
    Fig. 7. Effect after adding honeycomb artifacts. (a) Clean image captured by industrial camera; (b) interference image obtained by simulation
    Comparison of artifact removal results of honeycomb in experiment A. (a) Interfered graph; (b) mean filtering; (c) method in Ref.[11]; (d) method in Ref.[5]; (e) method in Ref.[15]; (f) method in Ref.[6]; (g) guided filtering; (h) proposed method
    Fig. 8. Comparison of artifact removal results of honeycomb in experiment A. (a) Interfered graph; (b) mean filtering; (c) method in Ref.[11]; (d) method in Ref.[5]; (e) method in Ref.[15]; (f) method in Ref.[6]; (g) guided filtering; (h) proposed method
    Comparison of artifact removal results of honeycomb in experiment B. (a) Interfered graph; (b) mean filtering; (c) method in Ref.[11]; (d) method in Ref.[5]; (e) method in Ref.[15]; (f) method in Ref.[6]; (g) guided filtering; (h) proposed method
    Fig. 9. Comparison of artifact removal results of honeycomb in experiment B. (a) Interfered graph; (b) mean filtering; (c) method in Ref.[11]; (d) method in Ref.[5]; (e) method in Ref.[15]; (f) method in Ref.[6]; (g) guided filtering; (h) proposed method
    Comparison of real artifact removal results of honeycomb in experiment C. (a) Interfered graph; (b) mean filtering; (c) method in Ref.[11]; (d) method in Ref.[5]; (e) method in Ref.[15]; (f) method in Ref.[6]; (g) guided filtering; (h) proposed method
    Fig. 10. Comparison of real artifact removal results of honeycomb in experiment C. (a) Interfered graph; (b) mean filtering; (c) method in Ref.[11]; (d) method in Ref.[5]; (e) method in Ref.[15]; (f) method in Ref.[6]; (g) guided filtering; (h) proposed method
    Comparison of real artifact removal results of honeycomb in experiment D. (a) Interfered graph; (b) mean filtering; (c) method in Ref.[11]; (d) method in Ref.[5]; (e) method in Ref.[15]; (f) method in Ref.[6]; (g) guided filtering; (h) proposed method
    Fig. 11. Comparison of real artifact removal results of honeycomb in experiment D. (a) Interfered graph; (b) mean filtering; (c) method in Ref.[11]; (d) method in Ref.[5]; (e) method in Ref.[15]; (f) method in Ref.[6]; (g) guided filtering; (h) proposed method
    Environment with white light illumination and light intensity of 100 lx. (a) Interfered graph; (b) mean filtering; (c) method in Ref.[11]; (d) method in Ref.[5]; (e) method in Ref.[15]; (f) method in Ref.[6]; (g) guided filtering; (h) proposed method
    Fig. 12. Environment with white light illumination and light intensity of 100 lx. (a) Interfered graph; (b) mean filtering; (c) method in Ref.[11]; (d) method in Ref.[5]; (e) method in Ref.[15]; (f) method in Ref.[6]; (g) guided filtering; (h) proposed method
    Environment with white light illumination and light intensity of 150 lx. (a) Interfered graph; (b) mean filtering; (c) method in Ref.[11]; (d) method in Ref.[5]; (e) method in Ref.[15]; (f) method in Ref.[6]; (g) guided filtering; (h) proposed method
    Fig. 13. Environment with white light illumination and light intensity of 150 lx. (a) Interfered graph; (b) mean filtering; (c) method in Ref.[11]; (d) method in Ref.[5]; (e) method in Ref.[15]; (f) method in Ref.[6]; (g) guided filtering; (h) proposed method
    Environment with blue light illumination and light intensity of 150 lx. (a) Interfered graph; (b) mean filtering; (c) method in Ref.[11]; (d) method in Ref.[5]; (e) method in Ref.[15]; (f) method in Ref.[6]; (g) guided filtering; (h) proposed method
    Fig. 14. Environment with blue light illumination and light intensity of 150 lx. (a) Interfered graph; (b) mean filtering; (c) method in Ref.[11]; (d) method in Ref.[5]; (e) method in Ref.[15]; (f) method in Ref.[6]; (g) guided filtering; (h) proposed method
    Environment with green light illumination and light intensity of 150 lx. (a) Interfered graph; (b) mean filtering; (c) method in Ref.[11]; (d) method in Ref.[5]; (e) method in Ref.[15]; (f) method in Ref.[6]; (g) guided filtering; (h) proposed method
    Fig. 15. Environment with green light illumination and light intensity of 150 lx. (a) Interfered graph; (b) mean filtering; (c) method in Ref.[11]; (d) method in Ref.[5]; (e) method in Ref.[15]; (f) method in Ref.[6]; (g) guided filtering; (h) proposed method
    ParameterValue
    Imaging optical fiber bundle length /mm1350
    Effective cross-section diameter /mm1.8
    Diameter of monofilament fiber /μm15
    Numerical aperture(NA)0.6
    Table 1. Related parameters of imaging optical fiber bundle
    MethodPSNR /dBSSIM
    Experiment AExperiment BExperiment AExperiment B
    Interfered image26.1526.700.550.58
    Mean filtering28.7829.520.760.82
    Method in Ref.[1114.8326.910.490.64
    Method in Ref.[528.7729.510.750.83
    Method in Ref.[1531.5233.140.820.90
    Method in Ref.[629.5430.470.810.89
    Guided filtering28.2628.870.720.76
    Proposed method33.5840.670.870.96
    Table 2. Quantitative index for removal results of honeycomb artifacts
    Xiaochuan Li, Guihua Liu, Ling Cao, Lei Deng. Restoration Algorithm for Honeycomb Artifacts Based on Optical Fiber Imaging[J]. Laser & Optoelectronics Progress, 2023, 60(12): 1210010
    Download Citation