• Laser & Optoelectronics Progress
  • Vol. 62, Issue 5, 0506006 (2025)
Zhihui Luo1,2,*, Jie Gao1, Shaohua Deng3, Xiaolong Wang1, and Yunrui He1
Author Affiliations
  • 1College of Mathematics and Physics, College of Nuclear Energy Science and Engineering, China Three Gorges University, Yichang 443002, Hubei , China
  • 2Hubei Engineering Research Center of Weak Magnetic-Field Detection, China Three Gorges University, Yichang 443002, Hubei , China
  • 3College of Mechanical & Power Engineering, China Three Gorges University, Yichang 443002, Hubei , China
  • show less
    DOI: 10.3788/LOP241468 Cite this Article Set citation alerts
    Zhihui Luo, Jie Gao, Shaohua Deng, Xiaolong Wang, Yunrui He. A Metal Strain Rosette Sensor Using Ultra-Weak Fiber Bragg Grating[J]. Laser & Optoelectronics Progress, 2025, 62(5): 0506006 Copy Citation Text show less
    Three-way strain rosette structures of UW-FBG fiber. (a) Equilateral triangle; (b) right triangle
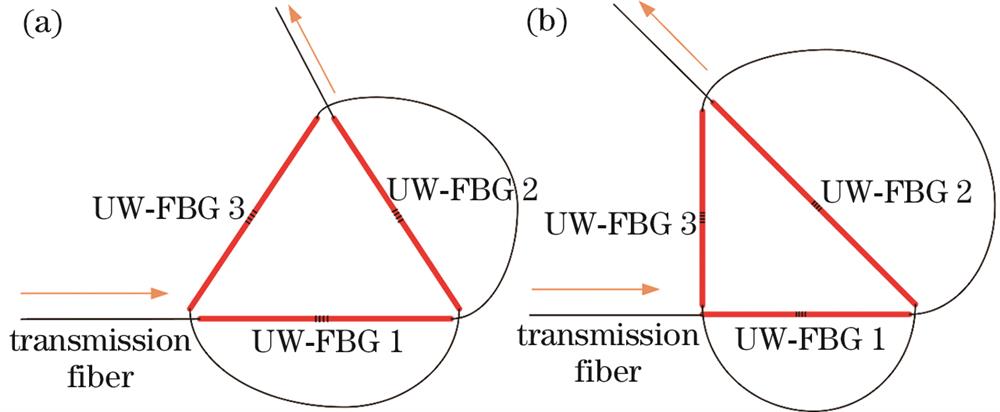
    Fig. 1. Three-way strain rosette structures of UW-FBG fiber. (a) Equilateral triangle; (b) right triangle
    Simulation of metal strain rosette substrate. (a) Schematic diagram of force; (b) simulated result
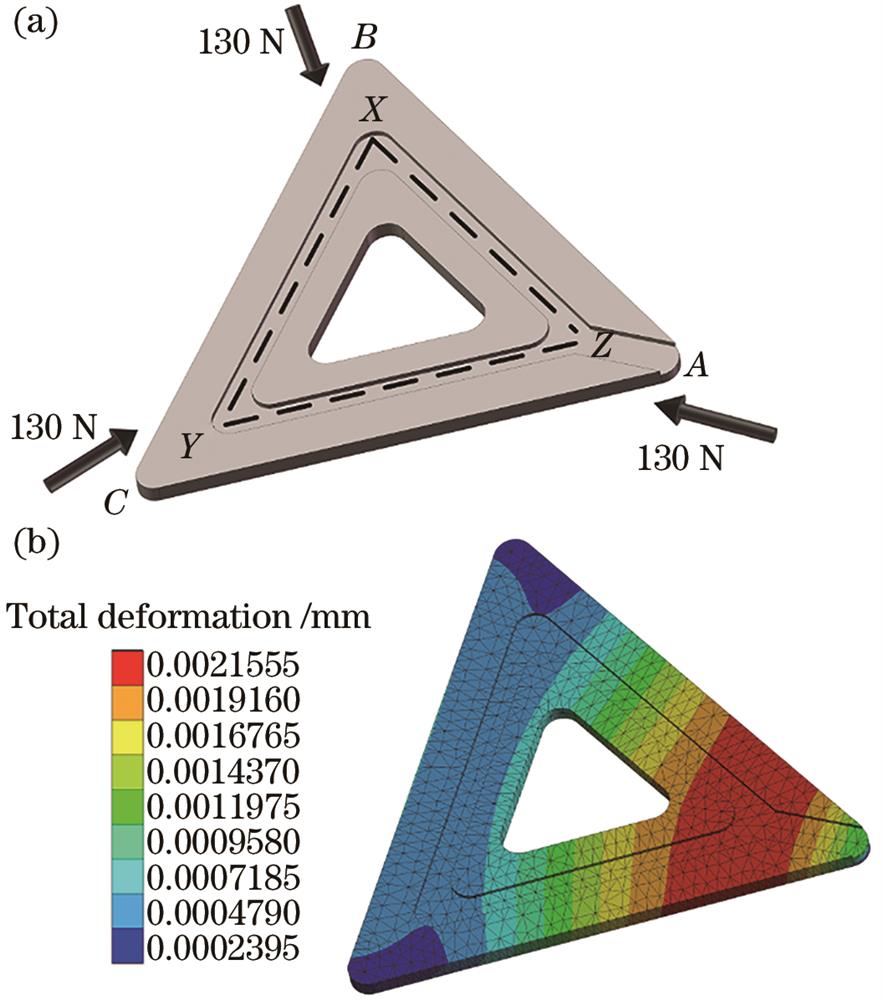
    Fig. 2. Simulation of metal strain rosette substrate. (a) Schematic diagram of force; (b) simulated result
    Deformations of different substrate models. Variation in deformations of (a) XY groove, and (b) XZ groove with groove depth when substrate thickness is 1.0 mm,and length of triangle side is 16 mm; variation in deformations of (c) XY groove, and (d) XZ groove with substrate thickness when groove depth is 0.5 mm, and length of triangle side is 16 mm; variation in deformations of (e) XY groove, and (f) XZ groove with length of triangle side when substrate thickness is 1.0 mm, and groove depth is 0.5 mm
    Fig. 3. Deformations of different substrate models. Variation in deformations of (a) XY groove, and (b) XZ groove with groove depth when substrate thickness is 1.0 mm,and length of triangle side is 16 mm; variation in deformations of (c) XY groove, and (d) XZ groove with substrate thickness when groove depth is 0.5 mm, and length of triangle side is 16 mm; variation in deformations of (e) XY groove, and (f) XZ groove with length of triangle side when substrate thickness is 1.0 mm, and groove depth is 0.5 mm
    Multi-factor histogram of deformation for different models. (a) Deformation of bottom; (b) deformation of side
    Fig. 4. Multi-factor histogram of deformation for different models. (a) Deformation of bottom; (b) deformation of side
    Dimension of metal strain rosette substrate
    Fig. 5. Dimension of metal strain rosette substrate
    UW-FBG metal strain rosette sensor. (a) Overall structure of sensor; (b) schematic diagram of welding
    Fig. 6. UW-FBG metal strain rosette sensor. (a) Overall structure of sensor; (b) schematic diagram of welding
    Designed simulation of different spot welding methods
    Fig. 7. Designed simulation of different spot welding methods
    Forcing experiment system of strain rosette sensor
    Fig. 8. Forcing experiment system of strain rosette sensor
    Fitted curves of load and wavelength shift in OAB direction. (a) Test 1; (b) test 2; (c) test 3
    Fig. 9. Fitted curves of load and wavelength shift in OAB direction. (a) Test 1; (b) test 2; (c) test 3
    Fitted curves of load and wavelength shift in XYZ direction. (a) Test 1; (b) test 2; (c) test 3
    Fig. 10. Fitted curves of load and wavelength shift in XYZ direction. (a) Test 1; (b) test 2; (c) test 3
    Tensile experiment system of strain rosette sensor
    Fig. 11. Tensile experiment system of strain rosette sensor
    Fitted curves of load and wavelength shift in tensile experiments. (a) Test 1; (b) test 2; (c) test 3
    Fig. 12. Fitted curves of load and wavelength shift in tensile experiments. (a) Test 1; (b) test 2; (c) test 3
    Fitted curves of temperature and wavelength for strain rosette sensor
    Fig. 13. Fitted curves of temperature and wavelength for strain rosette sensor
    Physical drawing of model test
    Fig. 14. Physical drawing of model test
    Fitted curves of load for different devices and wavelength shift or strain. (a) Fitted curves of load for strain rosette sensor and wavelength shift; (b) fitted curves of load for strain gauge and strain; (c) fitted curves of load for optic cable and wavelength shift
    Fig. 15. Fitted curves of load for different devices and wavelength shift or strain. (a) Fitted curves of load for strain rosette sensor and wavelength shift; (b) fitted curves of load for strain gauge and strain; (c) fitted curves of load for optic cable and wavelength shift
    Substrate modelGroove depthSubstrate thicknessLength of triangle side
    10.21.016
    20.51.016
    30.81.016
    41.01.016
    51.21.016
    60.51.016
    70.51.216
    80.51.416
    90.51.616
    100.51.816
    110.51.012
    120.51.013
    130.51.014
    140.51.015
    150.51.016
    Table 1. Designed substrate models
    Length of extented area /mmGroove strain /μεPrincipal strain /μεEfficiency /%
    ABACBCCalculatedSimulation
    11-284.005.00-7.00-284.13-352.0081
    12-289.0013.00-9.00-289.42-350.0083
    13-293.00-1.80-12.00-293.09-347.0084
    14-301.00-5.00-15.00-301.09-345.0087
    15-308.00-9.00-19.00-308.08-343.0090
    16-306.00-13.00-15.00-306.00-340.0090
    Table 2. Simulation results of 6 types for spot welding methods
    Number of testPrincipal strain /μεError of strain /%Principal strain direction /(°)Error of direction /%
    MeasuredCalculatedTheoreticalCalculated
    1-318.00-313.491.4290.0090.600.67
    2-320.00-318.480.4890.0090.530.59
    3-324.00-315.642.5890.0090.660.73
    Table 3. Measure results in OAB angular
    Number of testPrincipal strain /μεError of strain /%Principal strain direction /(°)Error of direction /%
    MeasuredCalculatedTheoreticalCalculated
    1-328.00-321.561.9690.0090.390.43
    2-326.00-320.601.6690.0090.290.32
    3-329.00-321.312.3490.0090.290.32
    Table 4. Measure results in XYZ angular
    Number of testPrincipal strain /μεError of strain /%Principal strain direction /(°)Error of direction /%
    MeasuredCalculatedTheoreticalCalculated
    1323.00311.193.6690.0090.580.64
    2317.00307.872.8890.0090.660.73
    3320.00310.053.1190.0090.350.39
    Table 5. Measurement results of tensile experiments
    Zhihui Luo, Jie Gao, Shaohua Deng, Xiaolong Wang, Yunrui He. A Metal Strain Rosette Sensor Using Ultra-Weak Fiber Bragg Grating[J]. Laser & Optoelectronics Progress, 2025, 62(5): 0506006
    Download Citation