
Zhao-Zhao Wei, Xiao Ma, Chang-Bo Ke, Xin-Ping Zhang. Molecular dynamics simulation of migration behavior of FCC-BCC atomic terrace-step phase boundary in iron-based alloy [J]. Acta Physica Sinica, 2020, 69(13): 136102-1
- Acta Physica Sinica
- Vol. 69, Issue 13, 136102-1 (2020)
![Schematic illustration of the stepped interface structure between parent and martensite phases in the topological model (in which the macroscopic planar habit plane is inclined to the terrace plane, or atomic habit plane, with an angle ψ)[12,13].](/richHtml/wlxb/2020/69/13/20191903/img_1.jpg)
Fig. 1. Schematic illustration of the stepped interface structure between parent and martensite phases in the topological model (in which the macroscopic planar habit plane is inclined to the terrace plane, or atomic habit plane, with an angle ψ )[12,13].
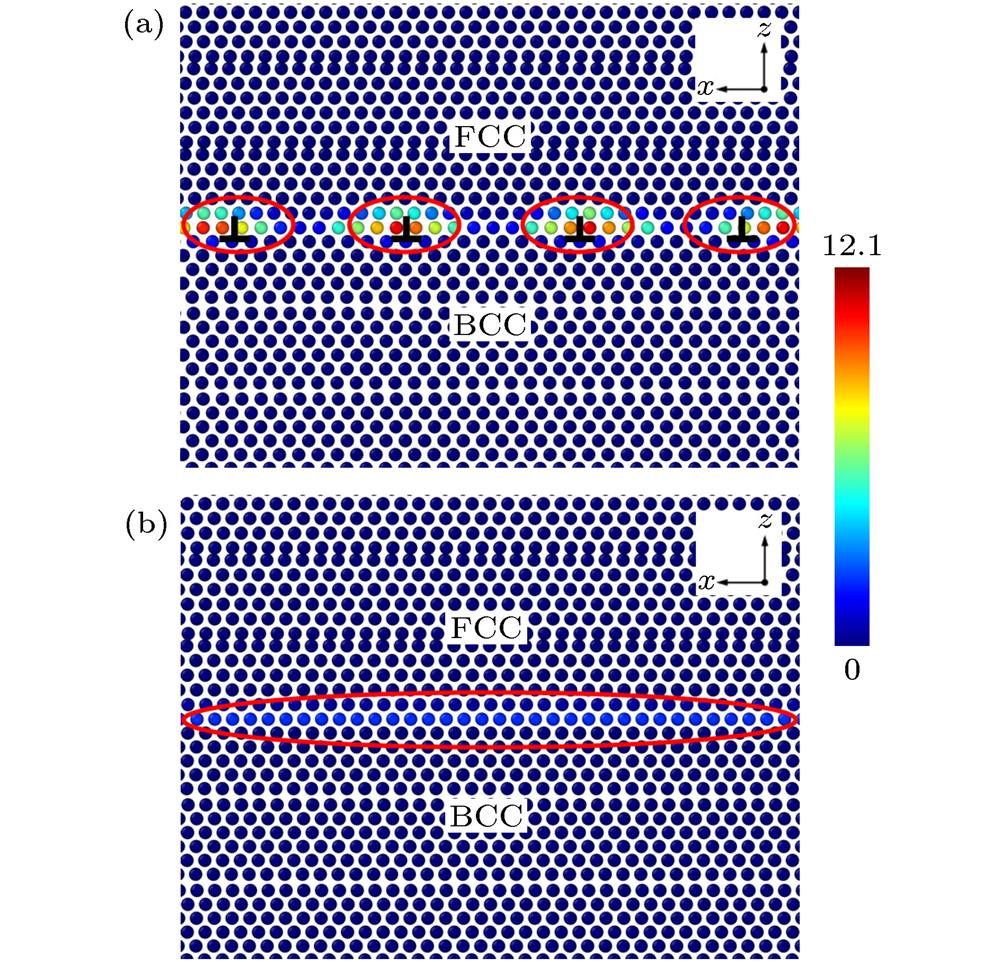
Fig. 2. The atomic configuration of interphase boundary between FCC and BCC crystals in (a) natural state and (b) constraint coherent state (in which the atoms are colored by their centrosymmetry parameters).
Fig. 3. Depiction of the formation of a transformation dislocation b
Fig. 4. Atomic configuration of the FCC-BCC biphasic system in Fe alloy evaluated by coordination number method where FCC crystal, BCC crystal and interphase boundary are represented by green, red and yellow dots respectively.
Fig. 5. RDF of the FCC-BCC system with (a) incoherent and (c) constraint coherent boundary; and evolution of the phase fractions with (b) incoherent and (d) constraint coherent boundary.
Fig. 6. Curves of the constraint coherent FCC/BCC boundary location versus time within 20 ps and snapshots of the crystal structure evolution process by MD simulation.
Fig. 7. View on the FCC/BCC boundary of
 //
//
 interface (in which the atoms are colored in terms of their potential energy).
//
interface (in which the atoms are colored in terms of their potential energy). Fig. 8. Snapshots of the evolution of the local structure and propagation of the
 //
//
 boundary at different times: (a) 0 ps; (b) 15 ps; (c) 30 ps (in which the atoms are colored by their coordinate number where green: FCC, red: BCC and yellow: phase boundary).
//
boundary at different times: (a) 0 ps; (b) 15 ps; (c) 30 ps (in which the atoms are colored by their coordinate number where green: FCC, red: BCC and yellow: phase boundary). Fig. 9. Atomic displacements on the terrace plane of (111)FCC//(110)BCC (in which the transformed configuration at 10.2 ps is superposed over the configuration at 10.0 ps).
Fig. 10. Configuration of the step-like constraint coherent interface between FCC and BCC crystals at (a) 10.0 ps and (b) 10.2 ps evaluated by common neighbor analysis method; and (c) the atomic displacements near the transforming boundary.
Fig. 11. Distribution of the strain field along the constraint coherent terrace plane calculated by relative displacements of atoms’ neighbors within a given cutoff radius of 3.2 Å.
Fig. 12. Schematic illustration of the transformation dislocation configuration at the stepped FCC/BCC boundary in the topological model.
|
Table 1. Comparison of the FCC → BCC transformation crystallographic characteristics obtained by MD simulation and topological model.


Set citation alerts for the article
Please enter your email address

© Copyright 2018-2021 | Chinese Laser Press. All Rights Reserved 沪ICP备15018463号-20