• Laser & Optoelectronics Progress
  • Vol. 59, Issue 24, 2418001 (2022)
Ning Zhang1,2, Guozhong Hou3, Yanyan Deng1,2, Shuo Liu1,2..., Yulei Wang1,2, Lü Zhiwei1,2 and Yuanqin Xia1,2,*|Show fewer author(s)
Author Affiliations
  • 1Center for Advanced Laser Technology, School of Electronic and Information Engineering, Hebei University of Technology, Tianjin 300401, China
  • 2Hebei Key Laboratory of Advanced Laser Technology and Equipment, Tianjin 300401, China
  • 3State Key Laboratory of Tunable Laser Technology, Harbin Institute of Technology, Harbin 150080, Heilongjiang, China
  • show less
    DOI: 10.3788/LOP202259.2418001 Cite this Article Set citation alerts
    Ning Zhang, Guozhong Hou, Yanyan Deng, Shuo Liu, Yulei Wang, Lü Zhiwei, Yuanqin Xia. Focusing Spectral CARS Microscopic Imaging in Low Fingerprint Regions[J]. Laser & Optoelectronics Progress, 2022, 59(24): 2418001 Copy Citation Text show less
    Schematic of the spectral focusing CARS microscope imaging system
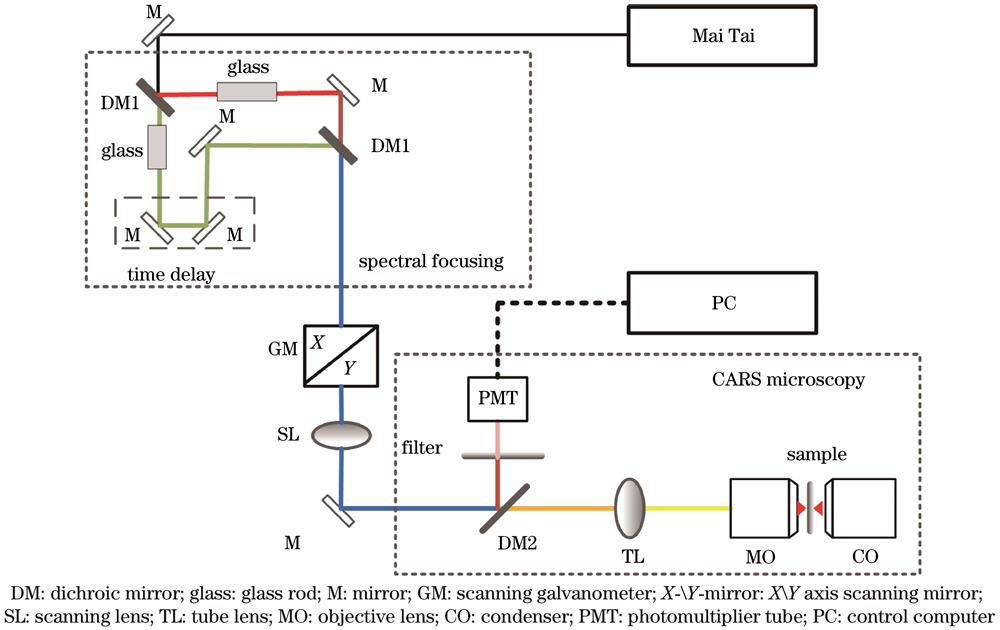
    Fig. 1. Schematic of the spectral focusing CARS microscope imaging system
    Total output spectrum of femtosecond laser oscillator and reflection/transmission of DM
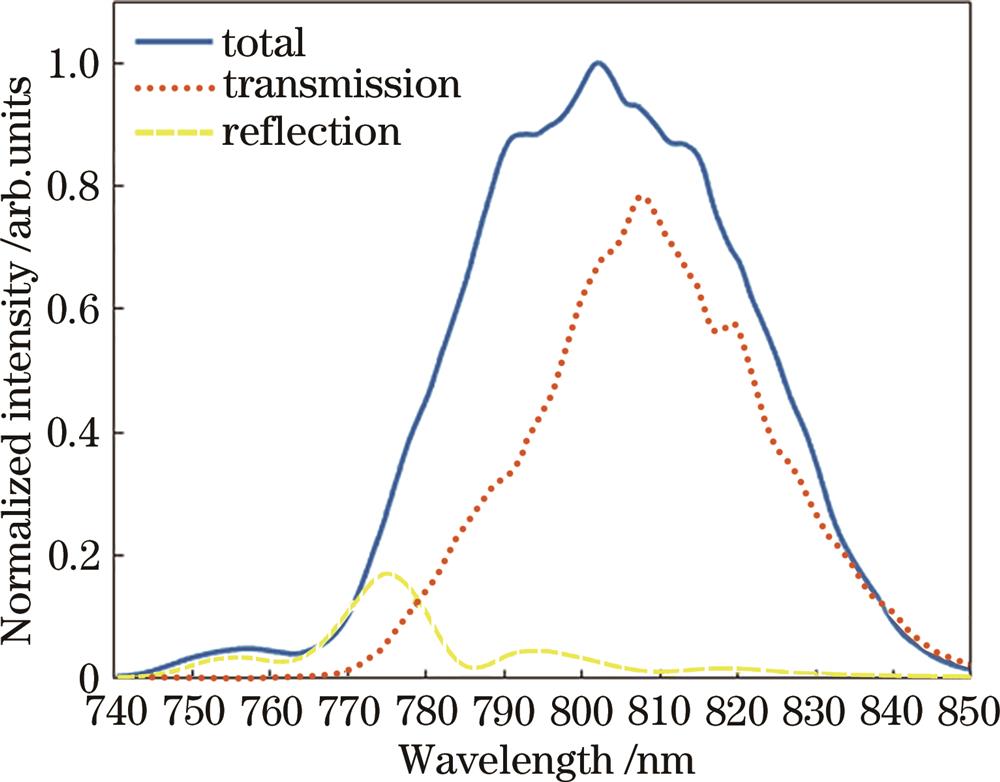
    Fig. 2. Total output spectrum of femtosecond laser oscillator and reflection/transmission of DM
    Signal contrast diagram. (a) Multiply frequency signal; (b) sum frequency signal
    Fig. 3. Signal contrast diagram. (a) Multiply frequency signal; (b) sum frequency signal
    CARS microscopic imaging results. (a) Image of the polystyrene powder sample in the field of view of the eyepiece; (b)-(g) CARS microscopic imaging results of sample in the red frame range with pump-Stokes delays of 100, 320, 540, 660, 900, and 1200 fs
    Fig. 4. CARS microscopic imaging results. (a) Image of the polystyrene powder sample in the field of view of the eyepiece; (b)-(g) CARS microscopic imaging results of sample in the red frame range with pump-Stokes delays of 100, 320, 540, 660, 900, and 1200 fs
    Comparison results. (a) Spectral focusing CARS signal intensity spectrum of polystyrene; (b) Raman spectrum of polystyrene
    Fig. 5. Comparison results. (a) Spectral focusing CARS signal intensity spectrum of polystyrene; (b) Raman spectrum of polystyrene
    Gaussian fitting result. (a) CARS microscopic imaging of polystyrene; (b) Gaussian fitting curve of CARS signal in region A
    Fig. 6. Gaussian fitting result. (a) CARS microscopic imaging of polystyrene; (b) Gaussian fitting curve of CARS signal in region A
    CARS microscopic imaging results. (a) Image of the polystyrene powder sample in the field of view of the eyepiece; (b)-(g) results of CARS microscopic imaging at the positions of 0, 4, 7, 10, 13, 16 μm obtained by Z-axis scanning
    Fig. 7. CARS microscopic imaging results. (a) Image of the polystyrene powder sample in the field of view of the eyepiece; (b)-(g) results of CARS microscopic imaging at the positions of 0, 4, 7, 10, 13, 16 μm obtained by Z-axis scanning
    Three-dimensional imaging results. (a) 3D reconstruction of nearly triangular polystyrene powder; (b) top view of 3D reconstruction
    Fig. 8. Three-dimensional imaging results. (a) 3D reconstruction of nearly triangular polystyrene powder; (b) top view of 3D reconstruction
    Ning Zhang, Guozhong Hou, Yanyan Deng, Shuo Liu, Yulei Wang, Lü Zhiwei, Yuanqin Xia. Focusing Spectral CARS Microscopic Imaging in Low Fingerprint Regions[J]. Laser & Optoelectronics Progress, 2022, 59(24): 2418001
    Download Citation