
Felix Fischer, Karsten Frenner, Massimo Granai, Falko Fend, Alois Herkommer. Data-driven development of sparse multi-spectral sensors for urological tissue differentiation[J]. Journal of the European Optical Society-Rapid Publications, 2023, 19(1): 2023030
Journals >Journal of the European Optical Society-Rapid Publications >Volume 19 >Issue 1 >Page 2023030 > Article
- Journal of the European Optical Society-Rapid Publications
- Vol. 19, Issue 1, 2023030 (2023)
Abstract
1 Introduction
Most spectral information in analyses of biological structures in human tissue is found in the broad (mid-infrared) MIR region [
Thus, modern MIR spectrometers tend to use quantum cascade lasers (QCLs), that are more powerful light sources with a higher spectral irradiance than conventionally used thermal SiC sources [
For a first estimate of the discriminability of human tissue with an extremly sparsified infrared (IR) spectrum, we measured urothelia and urothelial carcinoma of bladder entities. By utilizing several different data-driven feature selection (FS) methods [
According to that, we introduce an optical design for an attenuated total reflectance (ATR) spectrometer that enables the spatially resolved real-time discrimination of bladder tissue and show first measurements with a monochromatic light source. Simulations validate these measurements and show limits in the spatial resolution.
2 MIR spectroscopy of urological specimen
In this work, we have used the commercially available Fourier-transform infrared spectroscopy (FT-IR) spectrometer Spectrum Two® by PerkinElmer in combination with an ATR accessory that incorporates a diamond crystal. A spectral range from 4000 to 450 cm−1 is available with this setup. The spectrometer additionally provides a plunger with an adjustable pressure p.
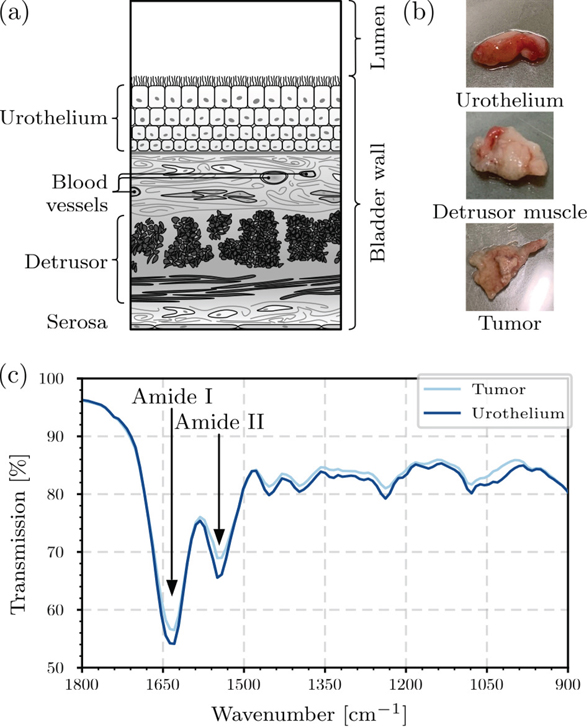
An overview of the constituents of intact bladder walls is given in
![]()
Figure 1.Overview of measured samples: cross-section of a bladder wall according to [
All spectra were obtained from eleven different patients, that have been diagnosed with bladder cancer. Every sample has been prepared and labeled by professional pathologists and physicians from the urology department of the University of Tübingen. Immediately after radical cystectomy, the bladder was transported to the laboratory. There, it has been opened completely and the urothelial surfaces of interest were cut into approx. 1 cm2 areas in order to fit into the spectrometer. For each patient, we have extracted two clearly separable excerpts of healthy urothelium and (if available) urothelial carcinoma. A detailed overview on the tumor staging is given in
2.1 Benefits of ATR spectroscopy
The key advantage of ATR spectroscopy compared to transmission spectroscopy is the obsolete sample preparation. Whereas transmission spectroscopy essentially depends on the sample thickness, ATR measurements always only measure the first few microns in depth of the surface.
![]()
Figure 2.Differences between transmission (a) and ATR spectroscopy (b).
According to Lambert’s law, the absorbance:
Another factor that decreases the signal intensity are reflections at each surface. However, spectral application usually use reference measurements without the sample for the calculation of the signal. Therefore, only the attenuation coefficient is recorded and the reflection can be neglected.
In contrast to the transmission spectroscopy, the absorbance in an ATR setup does not depend on the absolute thickness of the sample. As the evanescent wave at the boundary surface of an internal reflective element (IRE) can only penetrate the sample up to a certain depth,
According to [
2.2 Influences of the applied pressure on the tissue spectra
As already mentioned, we are also able to apply a defined pressure on top of the sample using a plunger. The maximum possible pressure is pmax = 5.3 MPa utilizing a plunger with a diameter of 6 mm. This is needed to restrain as much water from the sample as possible in order to reduce the interfering influences due to its high absorption coefficient in the MIR region.
The maximum pressure corresponds to an applied force of 150 N. In the dataset, each sample has been measured using forces in the range between 0 and 150 N with an increment of 10 per measurement.
The increasing pressing force has direct influence on the signal quality of the transmission spectrum, see
![]()
Figure 3.Spectra of an urothelial carcinoma under increasing pressing force. Lighter colors indicate lower pressure. The transmission is gradually reduced with increasing pressure (see peak transmission of amide I band displayed in the inset). The red line indicates a polynomial fit.
As the signal is heavily influenced by the pressing force, we also have to investigate the discriminability of samples with varying water content in the next section.
3 Feature selection to optimize spectral scans
The subsequent selection of relevant wavelengths for the spectral discrimination between healthy and diseased urological specimen is based on the measurements described in the previous section. This is the crucial part in engineering these types of sparse spectrometers.
In an earlier study, we have already shown that a differentiation of urothelia and detrusor muscles is possible with an extremely sparsified signal consisting of only two wavenumbers [
In order to select the q most relevant wavenumbers for an optimal differentiation, we have chosen different data-driven FS methods. When speaking of features in this context, wavenumbers are meant. The results of classical multivariate statistical approaches using principal component analysis (PCA) [
In total, the acquired dataset
3.1 Feature selection with PCA and LDA
As a first estimate on the separability of both classes C and T, the multivariate analyses PCA and LDA are used.
The linear transformations underlying these methods aim for a lower-dimensional representation of the original spectral dataset
We obtain this loadings matrix by solving the eigenvalue problem for the covariance matrix or scatter matrices respectively. What differs both types of transformations is that the LDA is not only using the covariances of the features but also profits from the prelabeled class information that is encoded in the scatter matrices. However, both analyses try to explain as much data as possible while using as little latent variables q as possible (i.e. p ≫ q). Since these variables are usually hard to interpret and even harder to measure directly, the weights of the transformation (i.e. the loadings) are used as a measure for the feature importance,
![]()
Figure 4.Comparison of the feature selection with PCA and LDA. The left side shows score plots of the complete spectra, where each point represents one measurement. Confidence intervals with 3σ are depicted as dashed ellipses and projected onto each component. The score plots on the right are calculated using only the p′ = 3 most important features (red rectangle). Note that the discriminative power of the LDA collapses.
Table Infomation Is Not EnableUnfortunately, the results of the PCA do not look promising for a good discriminability. The confidence intervals of both classes overlap almost entirely and their means are located at almost the exact same spot. However, the high explained variance of the first principal component (PC) with 95% show that the signals are highly correlated. This correlation is pronounced, since the differences in spectra measured with low applied pressures are always superimposed by the water signal. Reducing the input information to p = 3 wavenumber results in a small benefit in terms of the overlap of means and confidence intervals, but the classes are still not distinguishable.
As expected, the latent space of the LDA is noticeably more structured. By drawing a line parallel to the second LD, we are able to correctly classify the samples using the correct value of LD1 as a threshold (dotted line). Except from one measurement of the urothelium class, all samples can be clearly distinguished from another. Even though the correlation between both mean spectra in
3.2 Feature selection with neural networks
Another evaluation of the wavenumbers is done using FeaSel-Net [
During the training process of a classifier model, the feature importance,
The binary classifier model is optimized using the Adam [
This classifier is trained until the accuracy threshold τ = 95% is surpassed for Δe = 20 training epochs in a row. We also implemented a decay of this threshold with 5 × 10⁻⁴ per epoch that starts as soon as the algorithm is theoretically allowed to prune again. When these criteria are met, the training pauses. At training halt, the feature selection process is executed with a pruning rate of π = 0.2 for every recursive pruning step. A convergence is obtained as soon as p′ = 3 distilled wavenumbers are remaining. Inherent randomness in neural networks makes it indispensable to statistically evaluate multiple selections. Hence, we apply FeaSel-Net 25 times in a row and create a weighted Jaccard matrix
![]()
Figure 5.Weighted Jaccard matrix for 25 FeaSel-Net applications. Features that are often chosen together appear darker than less chosen ones. The chosen features are indicated by the red square.
FeaSel-Net converged in every application with the best run’s training history depicted in
![]()
Figure 6.Training history of one FS run with FeaSel-Net. The typical saw tooth pattern can be observed.
In the following, we make use of the wavenumbers retrieved from the best run. To compare the linear and non-linear methods, we need to apply the same reduction of input signal for the training of another neural network and train the model anew. Whereas the discriminative power of the LDA gets lost using only p′ = 3 and has never been available in PCA, the neural network approach seems to achieve significantly better results.
![]()
Figure 7.Discriminability of neural networks restricted to an ultra-sparse spectral input (p′ = 3).
Whilst the first model has trained using approx. 16.5k parameters, the second model only needs 368. Using only two percent of the original number of parameters is an enormous saving of computational costs. Despite all these reductions in complexity the training accuracy is satisfyingly good with 92.7 ± 2.9% and the validation accuracy is even better with 95.4 ± 2.9% on average over ten optimizations with 250 training epochs. The losses amount to 0.21 ± 0.04 for the training and 0.16 ± 0.05 for the validation.
An analysis of the impact on the classification using smaller pressures has additionally been conducted. When using small forces (0–10 N), an overall classification accuracy (OCA) of 81% is achieved. This instantly gets better when using forces greater or equal to 10 N where it is always more than 85% OCA.
4 Multi-spectral sensor concept
With all the savings of computational costs and the findings that a complete MIR spectrum is not necessary for tissue discrimination, we are allowed to confine ourselves on the spectral information from ultra-sparse illumination. Therefore, we propose a multi-spectral approach for the measurement of tissue samples using a spatially resolved ATR measurement system.
As depicted in
![]()
Figure 8.Schematic drawing of the proposed multi-spectral sensor for tissue discrimination.
A magnification of the IRE surface is made possible using an 4f beam expander. The macroscopic imaging technique from
In an experiment with silicone phantoms we validate the image magnification and want to assess the imaging quality, see
![]()
Figure 9.Measurements with the proposed multi-spectral sensor. The absorbance plot (left) shows the absorbance averaged over 12 px each. The colors indicate the area of averaging.
However, the results clearly show, that it is possible to image the absorption of silicone at an IRE’s boundary surface using a mesoscopic magnification setup. The slits with absent material are visible and the simulated magnification could be validated.
5 Conclusion
In this work, we have shown that it is possible to distinguish tumorous from healthy tissue using sparse mid-infrared spectroscopy in combination with IRE crystals and ultra-sparse illumination. The selection of the most important wavelengths for the engineering of the light source is done using different linear and non-linear feature selection algorithms.
Linear transformations (PCA and LDA) are not able to cope with the difficulties induced by the superimposing effects of water that tend to equalize the net spectra of both classes. Especially in low pressure applications of ATR spectroscopy, where the water content within the tissue is at high level, the results are sobering. Inherently non-linear transforming neural networks are a better alternative to discriminate the tissues and find suitable illuminating wavelengths. The influences of superimposition in the spectra due to water signals on the discriminative power is only a problem in measurements when absolutely no pressure is applied.
Furthermore, we have proposed a concept that enables real-time spatially resolved measurements, that could potentially even be used for in-vivo applications when integrated in endoscopes for example. One of the biggest challenges will be an economical production of such endoscopes and the miniaturization of IR optics.
References
[1] V.F. Kalasinsky. Biomedical applications of infrared and Raman microscopy.
[2] G.W. Ewing. Signal–to–noise enhancement in infrared absorption spectrophotometry.
[3] A. Schwaighofer, M. Brandstetter, B. Lendl. Quantum cascade lasers (QCLs) in biomedical spectroscopy.
[4] J.L. Klocke, M. Mangold, P. Allmendinger, A. Hugi, M. Geiser, P. Jouy, J. Faist, T. Kottke. Single-shot sub-microsecond mid-infrared spectroscopy on protein reactions with quantum cascade laser frequency combs.
[5] M.J. Weida, B. Yee. Quantum cascade laser-based replacement for FTIR microscopy.
[6] R. Ghorbani, F.M. Schmidt. Real-time breath gas analysis of CO and CO2 using an EC-QCL.
[7] D.I. Ellis, W.B. Dunn, J.L. Griffin, J.W. Allwood, R. Goodacre. Metabolic fingerprinting as a diagnostic tool.
[8] K.S. Maiti, E. Fill, F. Strittmatter, Y. Volz, R. Sroka, A. Apolonski. Towards reliable diagnostics of prostate cancer via breath.
[9] L. Becker, F. Fischer, J.L. Fleck, N. Harland, A. Herkommer, A. Stenzl, W.K. Aicher, K. Schenke-Layland, J. Marzi. Data-driven identification of biomarkers for in situ monitoring of drug treatment in bladder cancer organoids.
[10] F. Fischer, A. Birk, P. Somers, K. Frenner, C. Tarín, A. Herkommer. FeaSel-Net: A recursive feature selection callback in neural networks.
[11] H. Han. Nonnegative principal component analysis for mass spectral serum profiles and biomarker discovery.
[12] L. Lovergne, D. Ghosh, R. Schuck, A.A. Polyzos, A.D. Chen, M.C. Martin, E.S. Barnard, J.B. Brown, C.T. McMurray. An infrared spectral biomarker accurately predicts neurodegenerative disease class in the absence of overt symptoms.
[13] J. Ollesch, S.L. Drees, H.M. Heise, T. Behrens, T. Bruning, K. Gerwert. FTIR spectroscopy of biofluids revisited: An automated approach to spectral biomarker identification.
[14] D.S. Kaufman, W.U. Shipley, A.S. Feldman. Bladder cancer.
[15] S.P. Jost, J.A. Gosling, J.S. Dixon. The morphology of normal human bladder urothelium.
[16] B.A. John, N. Said. Insights from animal models of bladder cancer: Recent advances, challenges, and opportunities.
[17] S. Wang, S. Jin, Q. Shu, S. Wu. Strategies to get drugs across bladder penetrating barriers for improving bladder cancer therapy.
[18] M. Zacche, S. Srikrishna, L. Cardozo. Novel targeted bladder drug-delivery systems: A review.
[19] K.L. Andrew Chan, S.G. Kazarian. Attenuated total reflection Fourier-transform infrared (ATR-FTIR) imaging of tissues and live cells.
[20] J. Vongsvivut, D. Pérez-Guaita, B.R. Wood, P. Heraud, K. Khambatta, D. Hartnell, M.J. Hackett, M.J. Tobin. Synchrotron macro ATR-FTIR microspectroscopy for high-resolution chemical mapping of single cells.
[21] S.G. Kazarian, K.L.A. Chan. Micro- and macro-attenuated total reflection Fourier transform infrared spectroscopic imaging. Plenary Lecture at the 5th International Conference on Advanced Vibrational Spectroscopy, 2009, Melbourne, Australia.
[22] M. Milosevic.
[23] F. Fischer, K. Frenner, A.M. Herkommer. Sparse mid-infrared spectra enable real-time and in-vivo applications in tissue discrimination.
[24] D.P. Kingma, J. Ba. Adam: A method for stochastic optimization(2014).


Set citation alerts for the article
Please enter your email address

© Copyright 2018-2021 | Chinese Laser Press. All Rights Reserved 沪ICP备15018463号-20