• Optics and Precision Engineering
  • Vol. 30, Issue 12, 1406 (2022)
Chi WANG, Wei CHEN, Jianmei SUN*, Yuancheng ZHENG, and Feilu CHEN
Author Affiliations
  • Department of Precision Mechanical Engineering, Shanghai University, Shanghai200444, China
  • show less
    DOI: 10.37188/OPE.20223012.1406 Cite this Article
    Chi WANG, Wei CHEN, Jianmei SUN, Yuancheng ZHENG, Feilu CHEN. MEMS fiber optic acoustic sensor and performance testing method based on ultra-small GRIN fiber lens[J]. Optics and Precision Engineering, 2022, 30(12): 1406 Copy Citation Text show less
    Schematic diagram of the sensor structure
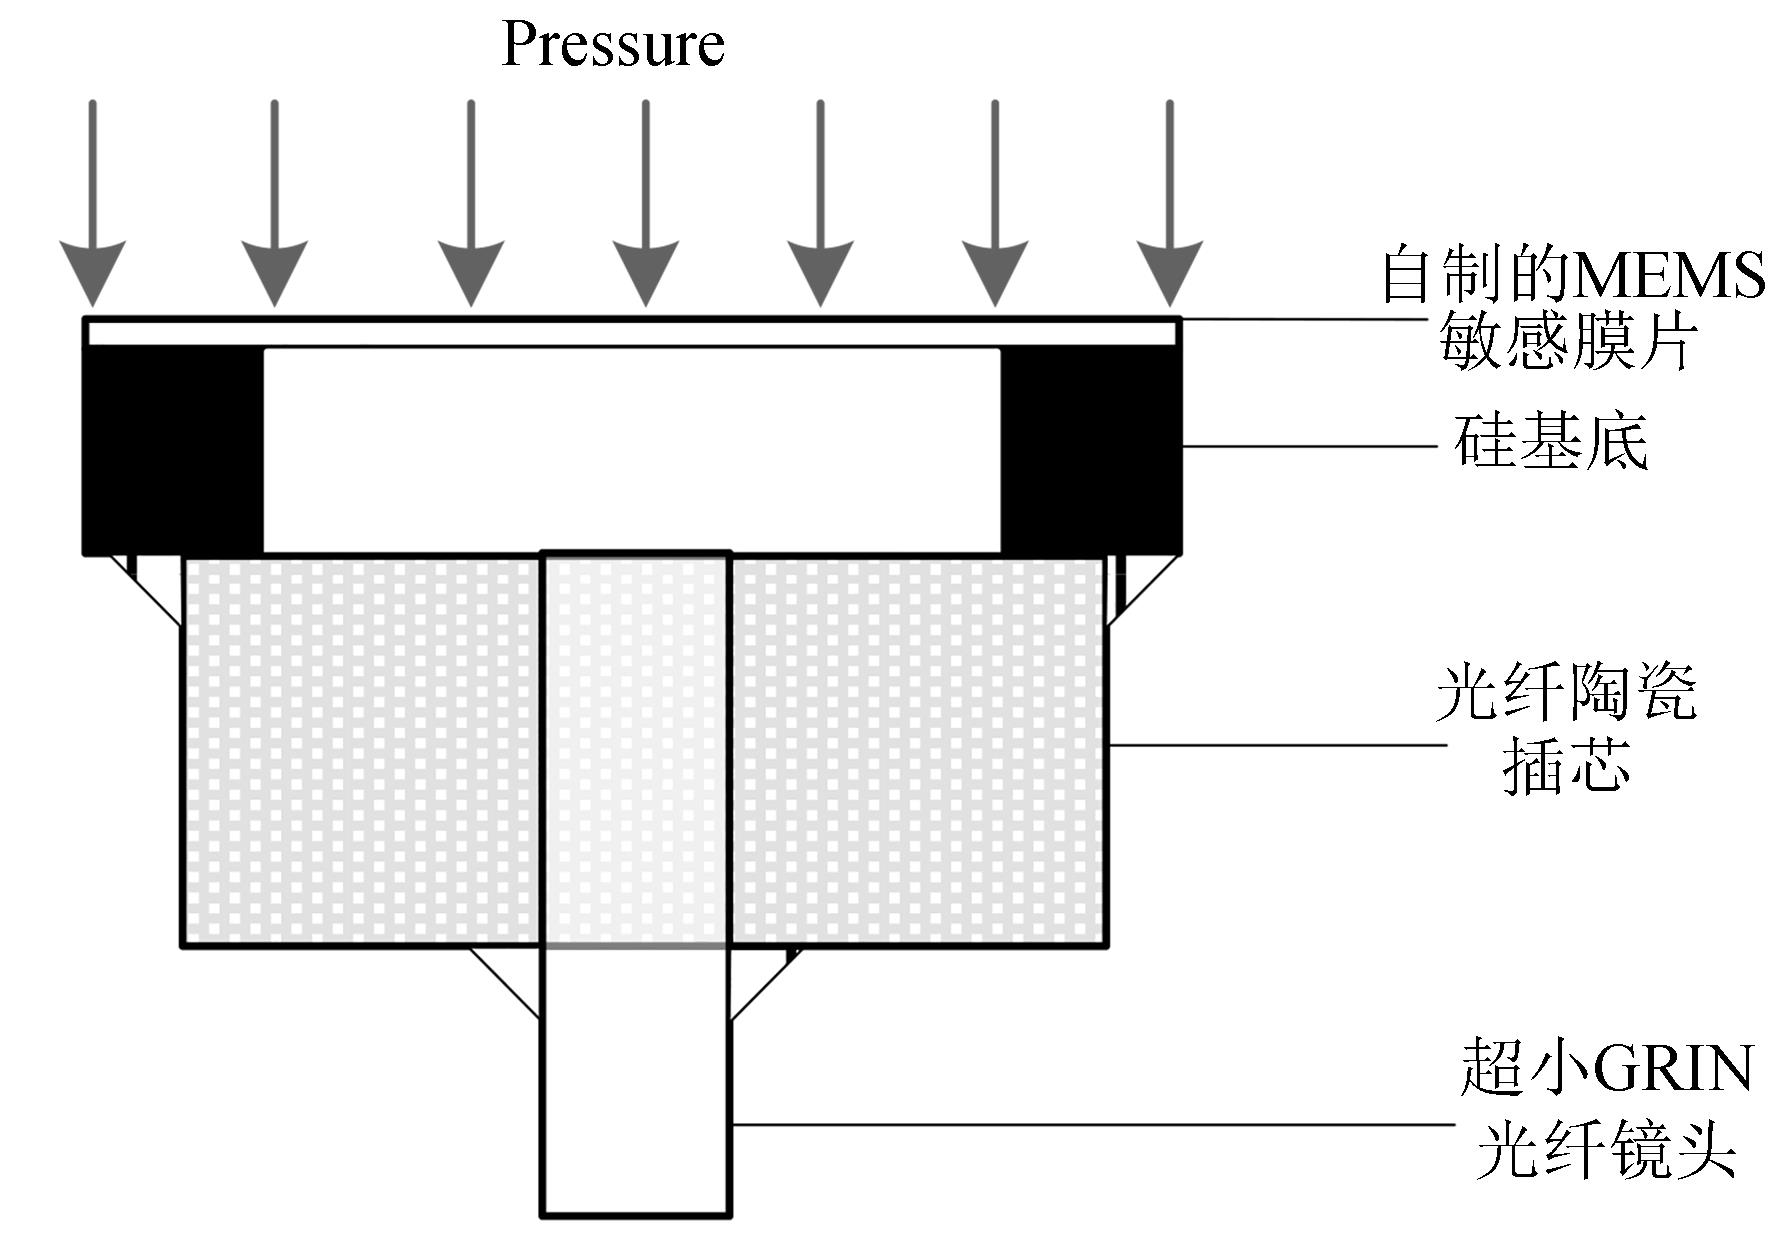
    Fig. 1. Schematic diagram of the sensor structure
    Model of ultra-small GRIN fiber probe
    Fig. 2. Model of ultra-small GRIN fiber probe
    Pressure stimulation results of the MEMS sensitive membrane
    Fig. 3. Pressure stimulation results of the MEMS sensitive membrane
    Relationship between form and position
    Fig. 4. Relationship between form and position
    Development process of ultra-small GRIN optical fiber lens
    Fig. 5. Development process of ultra-small GRIN optical fiber lens
    Photos of the MEMS film
    Fig. 6. Photos of the MEMS film
    Manufacturing steps of the sensor
    Fig. 7. Manufacturing steps of the sensor
    Image of the sensor head
    Fig. 8. Image of the sensor head
    Sensor performance detection model based on SS-OCT demodulation system
    Fig. 9. Sensor performance detection model based on SS-OCT demodulation system
    Performance test system of MEMS optical fiber acoustic sensor
    Fig. 10. Performance test system of MEMS optical fiber acoustic sensor
    Single frequency test under 300 Hz acoustic frequency
    Fig. 11. Single frequency test under 300 Hz acoustic frequency
    Single frequency response spectrogram
    Fig. 12. Single frequency response spectrogram
    Test under 100 Hz and 300 Hz mixed frequency
    Fig. 13. Test under 100 Hz and 300 Hz mixed frequency
    Frequency spectrum of dual-frequency signal
    Fig. 14. Frequency spectrum of dual-frequency signal
    Frequency spectrum of tri-band signal under 1 kHz,2 kHz and 3 kHz mixed frequency
    Fig. 15. Frequency spectrum of tri-band signal under 1 kHz,2 kHz and 3 kHz mixed frequency
    Frequency response characteristic of the sensor
    Fig. 16. Frequency response characteristic of the sensor
    Acoustic pressure response performance of the optical fiber acoustic pressure sensor
    Fig. 17. Acoustic pressure response performance of the optical fiber acoustic pressure sensor
    Frequency spectrum without signal input
    Fig. 18. Frequency spectrum without signal input
    Voltage/VPressure/PaAmplitude/μm
    1st day2nd day3rd day4th day
    0.200.259.2210.0110.2210.23
    0.400.3911.6412.2311.5812.13
    0.600.6316.5316.5216.9116.83
    0.800.8921.0322.3223.2419.48
    1.001.1226.9227.8328.1728.62
    1.201.2630.9231.0332.2231.43
    1.401.4134.3233.2134.2235.63
    Table 1. Sound pressure sensitivity of the sensor
    Chi WANG, Wei CHEN, Jianmei SUN, Yuancheng ZHENG, Feilu CHEN. MEMS fiber optic acoustic sensor and performance testing method based on ultra-small GRIN fiber lens[J]. Optics and Precision Engineering, 2022, 30(12): 1406
    Download Citation