• Laser & Optoelectronics Progress
  • Vol. 56, Issue 23, 231202 (2019)
Chunxiao Hao1,*, Wentao Zhang1,2, Xianying Wang2, and Xunzhi Huang2
Author Affiliations
  • 1School of Electronic Engineering and Automation, Guilin University of Electronic Technology, Guilin, Guangxi 541004, China
  • 2Shanghai Micro Electronics Equipment (Group) Co., Ltd., Shanghai 201203, China
  • show less
    DOI: 10.3788/LOP56.231202 Cite this Article Set citation alerts
    Chunxiao Hao, Wentao Zhang, Xianying Wang, Xunzhi Huang. Analysis and Verification of Position Error of Reticle Stage Based on Planar Grating[J]. Laser & Optoelectronics Progress, 2019, 56(23): 231202 Copy Citation Text show less
    Schematic of measurement optical paths of planar grating and laser interferometer
    Fig. 1. Schematic of measurement optical paths of planar grating and laser interferometer
    Installation layout of planar grating and laser interferometer of reticle stage
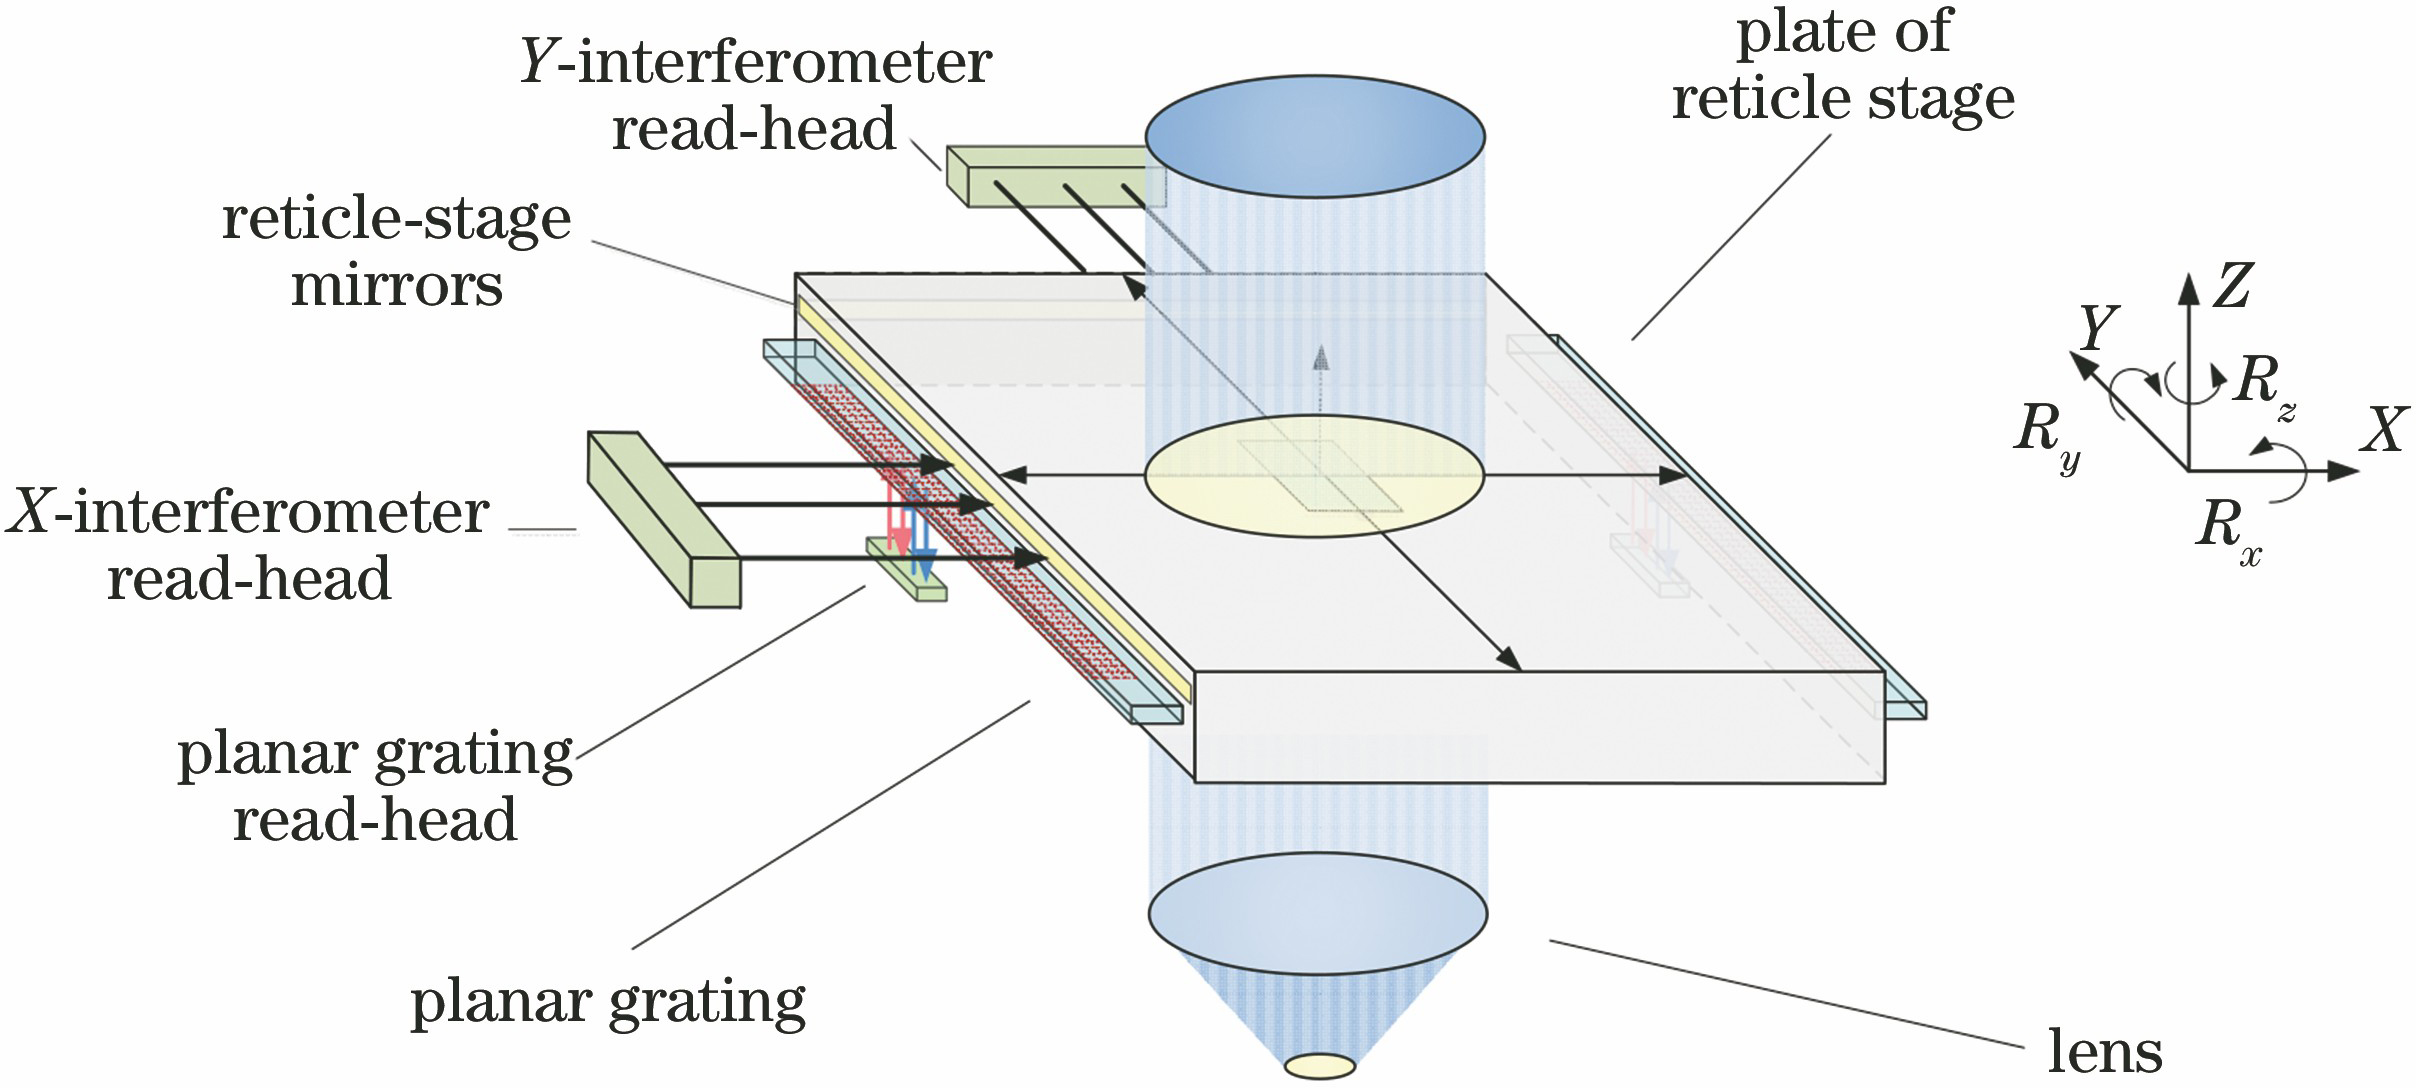
    Fig. 2. Installation layout of planar grating and laser interferometer of reticle stage
    Analytical diagrams of model errors. (a) Abbe error; (b) cosine error
    Fig. 3. Analytical diagrams of model errors. (a) Abbe error; (b) cosine error
    Error analysis diagrams of degree of freedom Rx with respect to degree of freedom in y direction
    Fig. 4. Error analysis diagrams of degree of freedom Rx with respect to degree of freedom in y direction
    Error analysis diagrams of degree of freedom Rz with respect to degree of freedom in y direction
    Fig. 5. Error analysis diagrams of degree of freedom Rz with respect to degree of freedom in y direction
    Error analysis diagrams of degree of freedom Ry with respect to degree of freedom in y direction
    Fig. 6. Error analysis diagrams of degree of freedom Ry with respect to degree of freedom in y direction
    Error analysis diagrams of degree of freedom Rz with respect to degree of freedom in y direction
    Fig. 7. Error analysis diagrams of degree of freedom Rz with respect to degree of freedom in y direction
    Error analysis diagrams of degrees of freedom y and Rx with respect to degree of freedom in y direction
    Fig. 8. Error analysis diagrams of degrees of freedom y and Rx with respect to degree of freedom in y direction
    Simulation results of Y-direction coupling coefficient. (a) First-order coupling coefficient; (b) high-order coupling coefficient
    Fig. 9. Simulation results of Y-direction coupling coefficient. (a) First-order coupling coefficient; (b) high-order coupling coefficient
    Experimental system for reticle stage measurement
    Fig. 10. Experimental system for reticle stage measurement
    Degree of freedomRangeStep
    X1.6 mm5
    Y240 mm3
    Rz1. 6 mrad3
    Table 1. Ranges of degree of freedom of reticle stage
    Degree of freedom coefficient /(mm·mrad-1)123
    ξRx2x-0.381-0.365-0.367
    ξRy2x-55.667-55.653-55.496
    ξRz2x-22.860-22.843-22.849
    ζRy.y2x-0.128-0.090-0.115
    ξRx2y43.85343.85043.834
    ξRy2y3.9433.9223.924
    ξRz2y-7.063-7.049-7.069
    ζRx.y2y-14.843-14.758-14.764
    ξRz2Rx1.6361.7731.773
    ξRz2Ry0.6070.6820.682
    ξRz2x3.6223.9653.965
    ζRx.y2Rx-2.966-4.096-4.096
    Table 2. Coupling coefficients of three degrees of freedom of planar grating
    InstrumentPhysical location3σ
    -120-60060120
    Laser interferometer-119.999-59.999-1.04485×10-760.000094120.0000921. 818×10-4
    Planar grating 1-120.000009-59.999998-4.811×10-660.000013120.0000043. 812×10-6
    Planar grating 2-120.000003-60.2312021-1.316×10-560.000006120.0000033. 897×10-5
    Planar grating 3-120.2312021-60.2312021-1.429×10-760.000001120.23120214. 892×10-6
    Table 3. Comparison of position accuracy between laser interferometer and planar gratingmm
    Chunxiao Hao, Wentao Zhang, Xianying Wang, Xunzhi Huang. Analysis and Verification of Position Error of Reticle Stage Based on Planar Grating[J]. Laser & Optoelectronics Progress, 2019, 56(23): 231202
    Download Citation