• Journal of Atmospheric and Environmental Optics
  • Vol. 19, Issue 3, 342 (2024)
FANG Wensheng, CAO Nianwen*, and SHI Xinchi
Author Affiliations
  • Collaborative Innovation Center on Forecast and Evaluation of Meteorological Disasters,Nanjing University of Information Science and Technology, Nanjing 210044
  • show less
    DOI: 10.3969/j.issn.1673-6141.2024.03.007 Cite this Article
    Wensheng FANG, Nianwen CAO, Xinchi SHI. Analysis of a synergistic pollution process of PM2.5 and ozone in Beijing-Tianjin-Hebei Region[J]. Journal of Atmospheric and Environmental Optics, 2024, 19(3): 342 Copy Citation Text show less
    Distribution and classification of observation sites
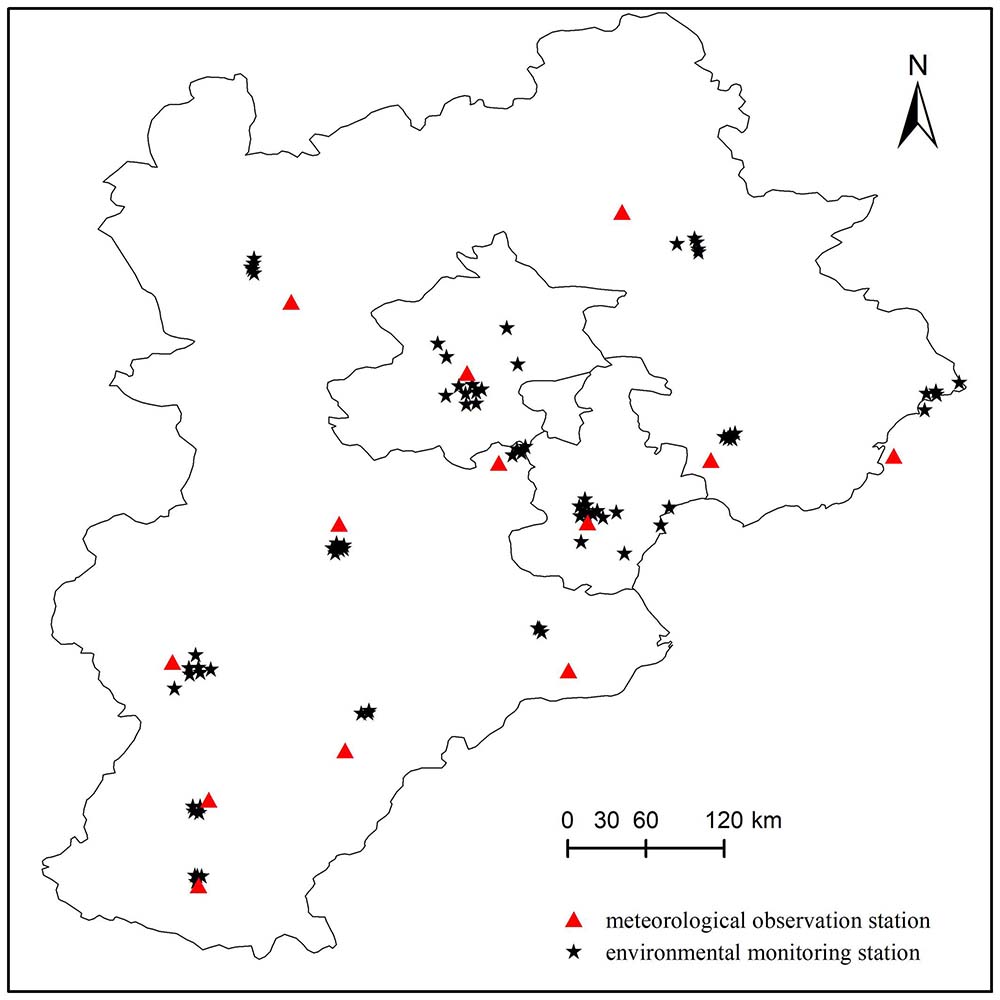
    Fig. 1. Distribution and classification of observation sites
    Variations of PM2.5 (a), O3 (b), temperature (c), pressure (d), wind speed (e) and relative humidity(f) during the monitoring period (April 16-22, 2018)
    Fig. 2. Variations of PM2.5 (a), O3 (b), temperature (c), pressure (d), wind speed (e) and relative humidity(f) during the monitoring period (April 16-22, 2018)
    Statistics of times of exceeding the standard of hourly ozone mass concentration value
    Fig. 3. Statistics of times of exceeding the standard of hourly ozone mass concentration value
    Pollution status at environmental monitoring stations during 16-22 April, 2018
    Fig. 4. Pollution status at environmental monitoring stations during 16-22 April, 2018
    Meteorology and ground observation map during 18-21 April, 2018
    Fig. 5. Meteorology and ground observation map during 18-21 April, 2018
    [in Chinese]
    Fig. 6. [in Chinese]
    Mean profiles of optical parameters at 02:11 on 19th April, 2018. (a) Extinction coefficient; (b) backscattering coefficient;(c) depolarization ratio; (d) color ratio
    Fig. 7. Mean profiles of optical parameters at 02:11 on 19th April, 2018. (a) Extinction coefficient; (b) backscattering coefficient;(c) depolarization ratio; (d) color ratio
    Aerosol distribution at 12:51 on 19th April, 2018
    Fig. 8. Aerosol distribution at 12:51 on 19th April, 2018
    Mean profiles of optical parameters at 12:51 on 19th April, 2018. (a) Extinction coefficient; (b) backscattering coefficient;(c) depolarization ratio; (d) color ratio
    Fig. 9. Mean profiles of optical parameters at 12:51 on 19th April, 2018. (a) Extinction coefficient; (b) backscattering coefficient;(c) depolarization ratio; (d) color ratio
    24 h HYSPLIT backward trajectory. (a) 02:00 a.m. on the 19th; (b) 13:00 p.m. on the 19th
    Fig. 10. 24 h HYSPLIT backward trajectory. (a) 02:00 a.m. on the 19th; (b) 13:00 p.m. on the 19th
    Relationship between the hourly average mass concentration of PM2.5 and wind direction (a), ozone and wind direction (b)
    Fig. 11. Relationship between the hourly average mass concentration of PM2.5 and wind direction (a), ozone and wind direction (b)
    Aerosol typeDepolarization ratioColor ratioBackscattering coefficient/(km-1·sr-1)
    Clean< 0.075< 0.0005
    Dust> 0.200> 0.5
    Pollution< 0.075< 0.5> 0.0005
    Mixed0.075-0.200
    Table 1. The classification standard of aerosol types
    ParameterTemperaturePressureWind speedRelative humidityPM2.5O3
    PM2.50.209**-0.367**-0.197**0.167*0.1077*
    O30.515**-0.376**0.287**-0.457**0.1077*
    Table 2. The correlation analysis of pollutant impact factors
    Wensheng FANG, Nianwen CAO, Xinchi SHI. Analysis of a synergistic pollution process of PM2.5 and ozone in Beijing-Tianjin-Hebei Region[J]. Journal of Atmospheric and Environmental Optics, 2024, 19(3): 342
    Download Citation