• Spectroscopy and Spectral Analysis
  • Vol. 41, Issue 11, 3357 (2021)
Yan-de LIU*, Zhen XU, Jun HU, Mao-peng LI, and Hui-zhen CUI
Author Affiliations
  • School of Mechanical, Electrical and Vehicle Engineering, East China Jiaotong University, Nanchang 330013, China
  • show less
    DOI: 10.3964/j.issn.1000-0593(2021)11-3357-06 Cite this Article
    Yan-de LIU, Zhen XU, Jun HU, Mao-peng LI, Hui-zhen CUI. Research on Variety Identification of Fritillaria Based on Terahertz Spectroscopy[J]. Spectroscopy and Spectral Analysis, 2021, 41(11): 3357 Copy Citation Text show less
    Schematic diagram of Terahertz equipment
    Fig. 1. Schematic diagram of Terahertz equipment
    Flowchart of fritillary classification
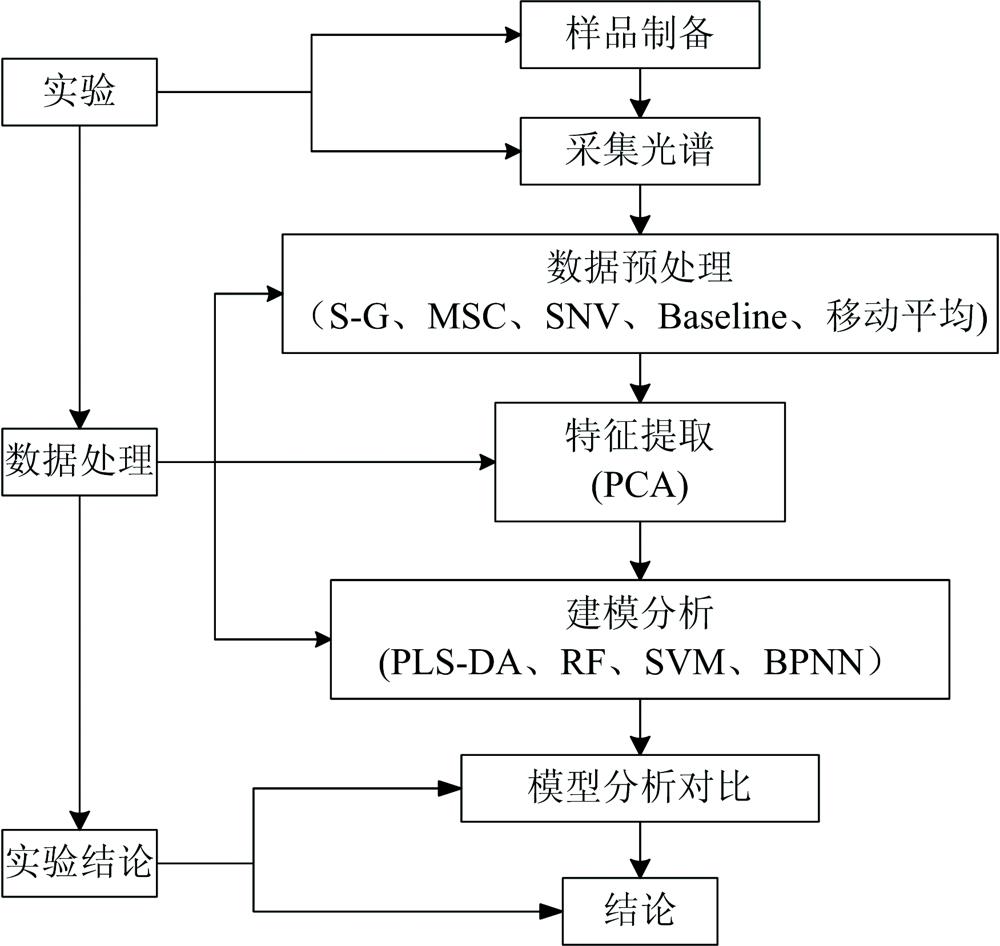
    Fig. 2. Flowchart of fritillary classification
    Mean absorption spectra of the four fritillaria species
    Fig. 3. Mean absorption spectra of the four fritillaria species
    PLS-DA dichotomy model of 6 categories
    Fig. 4. PLS-DA dichotomy model of 6 categories
    Relationship between principal component number and variance contribution rate
    Fig. 5. Relationship between principal component number and variance contribution rate
    Three-dimensional scores of first three principal components of four fritillaria species
    Fig. 6. Three-dimensional scores of first three principal components of four fritillaria species
    模型整体正确率/%各类正确率/%
    川贝母
    平贝母
    100100
    100
    川贝母
    伊贝母
    93.33391.667
    95
    川贝母
    浙贝母
    100100
    100
    平贝母
    伊贝母
    100100
    100
    平贝母
    浙贝母
    98.33396.923
    100
    伊贝母
    浙贝母
    100100
    100
    Table 1. Classification accuracy of PLS-DA model
    分类模型预处理方法主成分数川贝母/%平贝母/%伊贝母/%浙贝母/%整体/%
    RF691.22895.00084.74693.75091.250
    S-G580.85190.04593.75090.32389.583
    MSC1387.273100.00085.714100.00094.167
    SNV1386.44198.50896.364100.00095.417
    移动平均492.45286.79390.00090.62590.000
    Baseline offset587.50098.41394.91588.70895.200
    SVM690.62578.33390.00096.86888.750
    S-G580.09072.13184.74690.56682.083
    MSC1391.667100.00096.491100.00096.250
    SNV1397.490100.00096.552100.00097.490
    移动平均482.09062.50089.47480.76978.333
    Baseline offset583.33394.44490.00083.33387.500
    BPNN679.688083.33374.06780.35779.167
    S-G568.65755.73872.88162.26465.000
    MSC1361.85780.00085.96588.63678.750
    SNV1382.55883.33374.138073.81079.167
    移动平均476.11940.62578.94448.07761.250
    Baseline offset572.22277.77858.33374.07470.417
    Table 2. Comparison of multiple classification results of fritillaria
    Yan-de LIU, Zhen XU, Jun HU, Mao-peng LI, Hui-zhen CUI. Research on Variety Identification of Fritillaria Based on Terahertz Spectroscopy[J]. Spectroscopy and Spectral Analysis, 2021, 41(11): 3357
    Download Citation