
Yabo Liu, Xiaoquan Yang, Tao Jiang. High Dynamic Range Image Compression Based on a Multi-Scale Feature Network[J]. Laser & Optoelectronics Progress, 2025, 62(4): 0437007
- Laser & Optoelectronics Progress
- Vol. 62, Issue 4, 0437007 (2025)
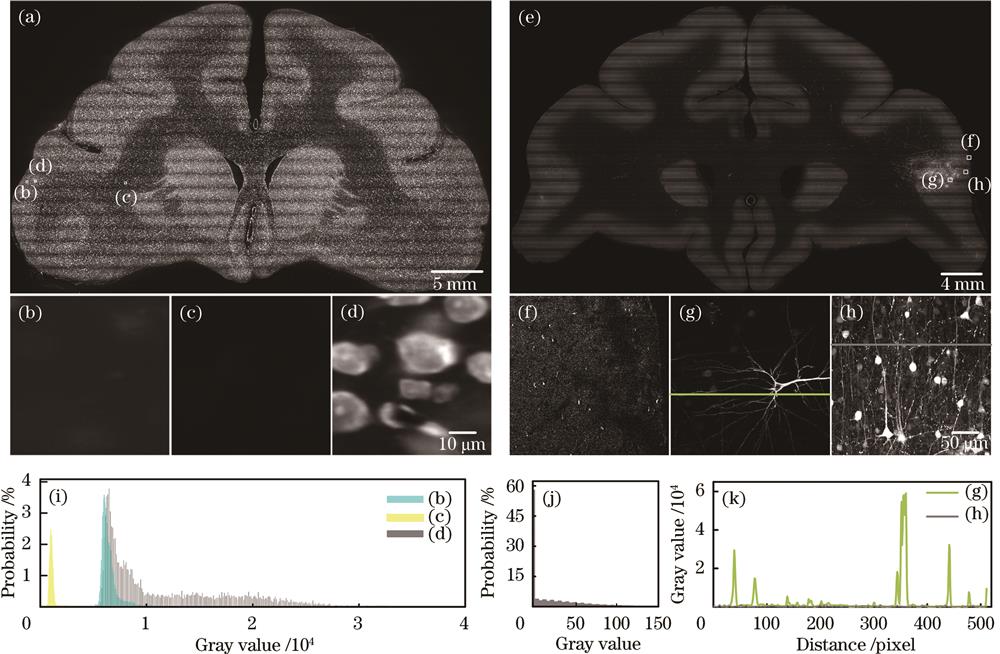
Fig. 1. Cellular architecture data and neural fiber data of the macaque brain. (a) Cellular architecture data; (b) gray matter background data of cortex; (c) white matter background data near the internal capsule; (d) signal data of cortex; (e) neural fiber data; (f) background data; (g) signal data of the soma and dendrite; (h) signal data of the axon terminal; (i) gray frequency histogram corresponding to (b)‒(d); (j) gray frequency histogram corresponding to (f); (k) gray value change curve corresponding to (g) and (h)
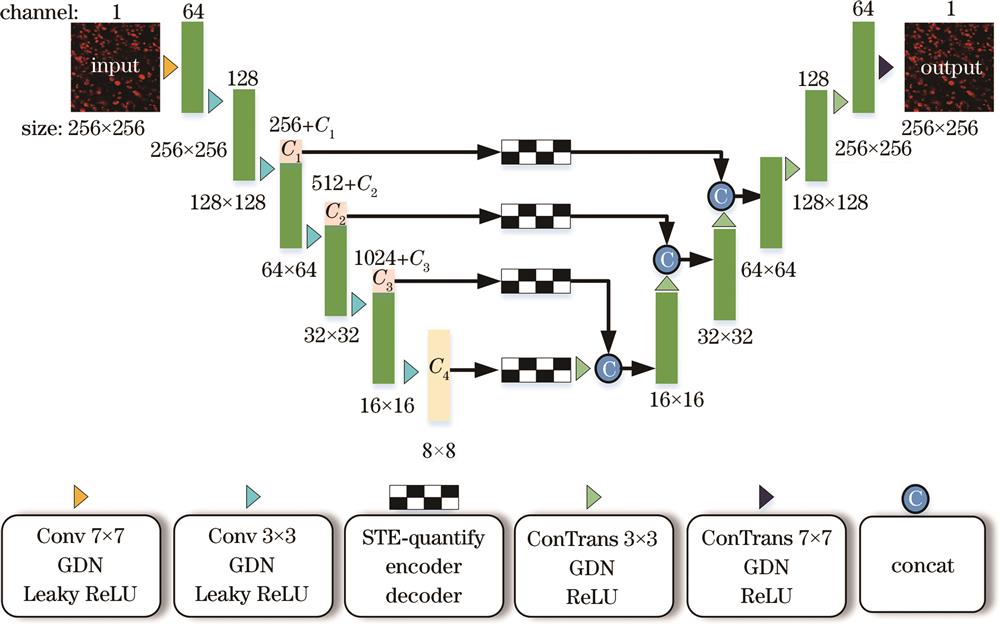
Fig. 2. Overall network structure of MCNet
Fig. 3. Comparison of the rate-distortion curves for various methods on the cellular architecture dataset. (a) MS-SSIM; (b) PSNR
Fig. 4. Comparison of reconstruction results for different methods at various compression ratios on the cellular architecture dataset. (a1)‒(a5) Reconstructed images of different methods at low compression ratios; (b1)‒(b5) reconstructed images of different methods at high compression ratios; (c) gray value variation curves corresponding to the dotted lines in (a1)‒(a5); (d) gray value variation curves corresponding to the dotted lines in (b1)‒(b5)
Fig. 5. Comparison of the rate-distortion curves for various methods on the nerve fiber dataset. (a) MS-SSIM; (b) PSNR
Fig. 6. Comparison of the reconstruction results for different methods at various compression ratios on the neural fiber dataset. (a1)‒(a4) Reconstructed images of terminal region data by different methods at low compression ratios; (b1)‒(b4) reconstructed images of terminal region data by different methods at high compression ratios; (c) reconstructed images of soma data by different methods at high compression ratios; (d) gray value variation curves corresponding to the dotted lines in (a1)‒(a4); (e) gray value variation curves corresponding to the dotted lines in (b1)‒(b4); (f) gray value variation curves corresponding to the dotted lines in (c1)‒(c4)
Fig. 7. Reconstruction images and comparison of resolution for nerve fiber data by different methods. (a) Reconstruction images; (b) comparison of resolution corresponding to the dotted lines in (a)
Fig. 8. Comparison of the rate-distortion curves fordifferent models


Set citation alerts for the article
Please enter your email address

© Copyright 2018-2021 | Chinese Laser Press. All Rights Reserved 沪ICP备15018463号-20