• Infrared and Laser Engineering
  • Vol. 53, Issue 6, 20240114 (2024)
Meng ZHAO1, Huijun XIA2,*, Ruize CHAO1,3, Ming SHAO4..., Xiangzheng CHENG4, Lanshuang LU1, Zheng QIU1, Haimeng LIU1 and Yong TAN1|Show fewer author(s)
Author Affiliations
  • 1CollegeofScience, ChangchunUniversityofScienceandTechnology, JilinKeyLaboratoryof SpectralDetectionScienceandTechnology, Changchun130022, China
  • 2Southwest Institute of Technical Physics, Chengdu, Sichuan 610046, China
  • 3Northwest Industrial Group Co., Ltd., Design Institute No. 3, Xi'an, Shaanxi 710005, China
  • 4Key Laboratory of Electro-Optical Countermeasures Test & Evaluation Technology, Luoyang 471003, China
  • show less
    DOI: 10.3788/IRLA20240114 Cite this Article
    Meng ZHAO, Huijun XIA, Ruize CHAO, Ming SHAO, Xiangzheng CHENG, Lanshuang LU, Zheng QIU, Haimeng LIU, Yong TAN. Study on temperature inversion of deflagration spectrum of pyrotechnics[J]. Infrared and Laser Engineering, 2024, 53(6): 20240114 Copy Citation Text show less
    Schematic diagram of the experimental device
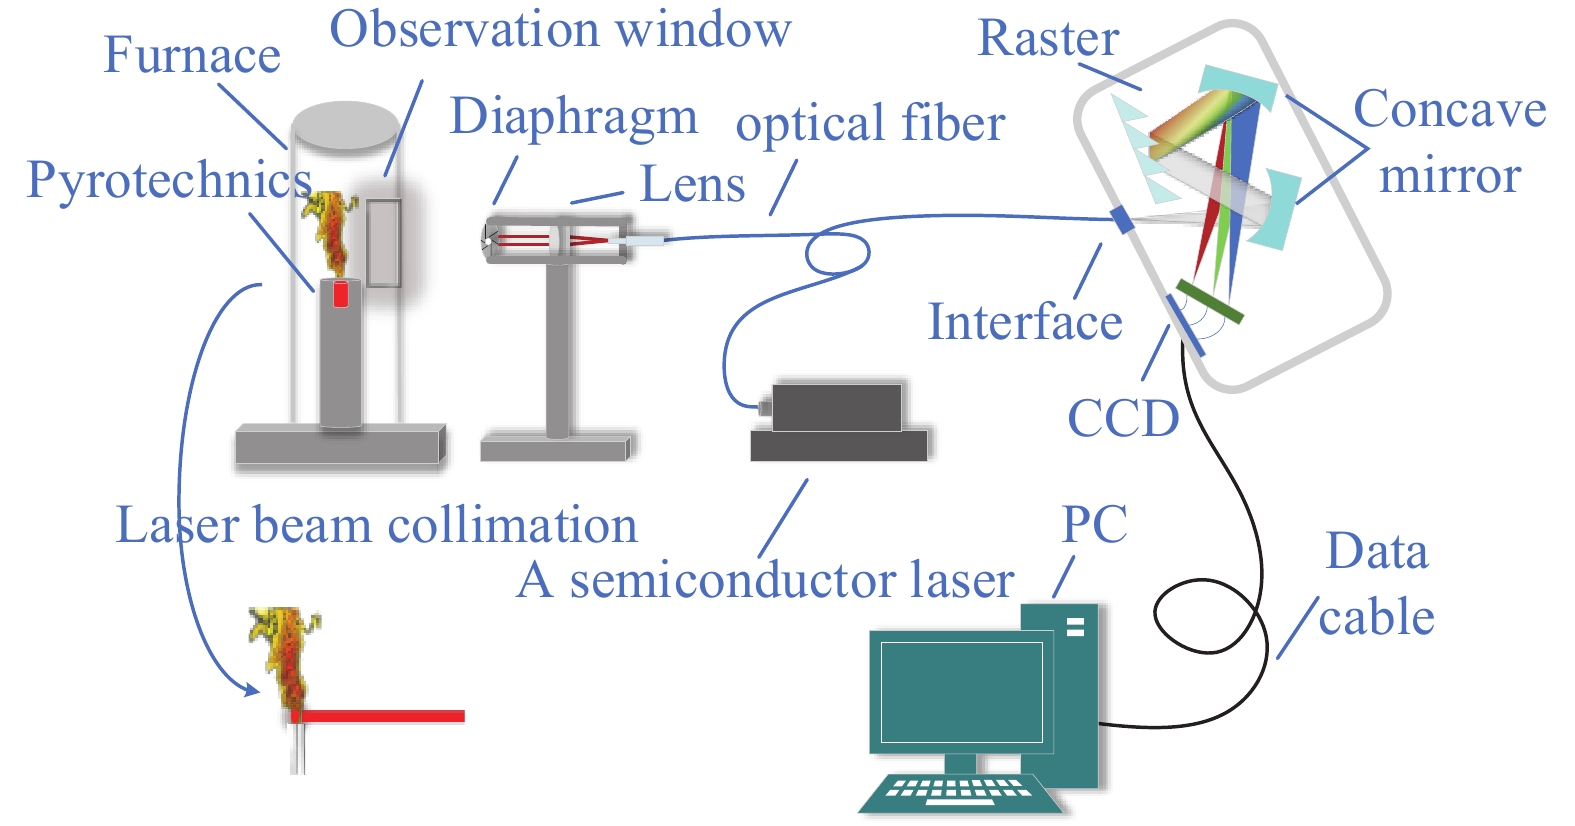
    Fig. 1. Schematic diagram of the experimental device
    Improved Wien criterion spectral data processing flowchart
    Fig. 2. Improved Wien criterion spectral data processing flowchart
    Deflagration 1 ms to 200 ms spectral curve
    Fig. 3. Deflagration 1 ms to 200 ms spectral curve
    Wavelength response curve
    Fig. 4. Wavelength response curve
    Spectral curve of deflagration radiation of pyrotechnic agent after correction
    Fig. 5. Spectral curve of deflagration radiation of pyrotechnic agent after correction
    Radiation spectrum of different deflagration stages
    Fig. 6. Radiation spectrum of different deflagration stages
    Spectral curve after Wien transform
    Fig. 7. Spectral curve after Wien transform
    Spectral fitting curve after Wien transform. (a) 1 ms; (b) 52 ms; (c) 60 ms; (d) 191 ms
    Fig. 8. Spectral fitting curve after Wien transform. (a) 1 ms; (b) 52 ms; (c) 60 ms; (d) 191 ms
    Temperature change during deflagration of pyrotechnic agent
    Fig. 9. Temperature change during deflagration of pyrotechnic agent
    ComponentProportioningMelting point /℃FunctionGranularity/μm
    C15%3500Combustible agent-
    S10%115Combustible agent-
    KNO375%334Oxidizing agent-
    Al2O3-2054Temperature indicating particles0.23
    Table 1. Pyrotechnic composition ratio and function
    Time/msGradientTemperature /KSum of squares of residuals
    1$ -5.456\times {10}^{-6} $-1225.387
    52$ -6.453\times {10}^{-6} $222839.801
    60$ -6.422\times {10}^{-6} $224948.344
    191$ -9.497\times {10}^{-6} $1514774.784
    Table 2. Fitting temperature and fitting error of pyrotechnic agents at different detonation stages
    Meng ZHAO, Huijun XIA, Ruize CHAO, Ming SHAO, Xiangzheng CHENG, Lanshuang LU, Zheng QIU, Haimeng LIU, Yong TAN. Study on temperature inversion of deflagration spectrum of pyrotechnics[J]. Infrared and Laser Engineering, 2024, 53(6): 20240114
    Download Citation