
Yi Li, Xiaoqiang Wang, Zhiqiao Chen, Shifeng Wen, Yusheng Shi. Forming Quality and Mechanical Properties of Different Types of NiTi Alloy Gyroid Lattice Structures Fabricated via Selective Laser Melting[J]. Chinese Journal of Lasers, 2025, 52(8): 0802302
- Chinese Journal of Lasers
- Vol. 52, Issue 8, 0802302 (2025)
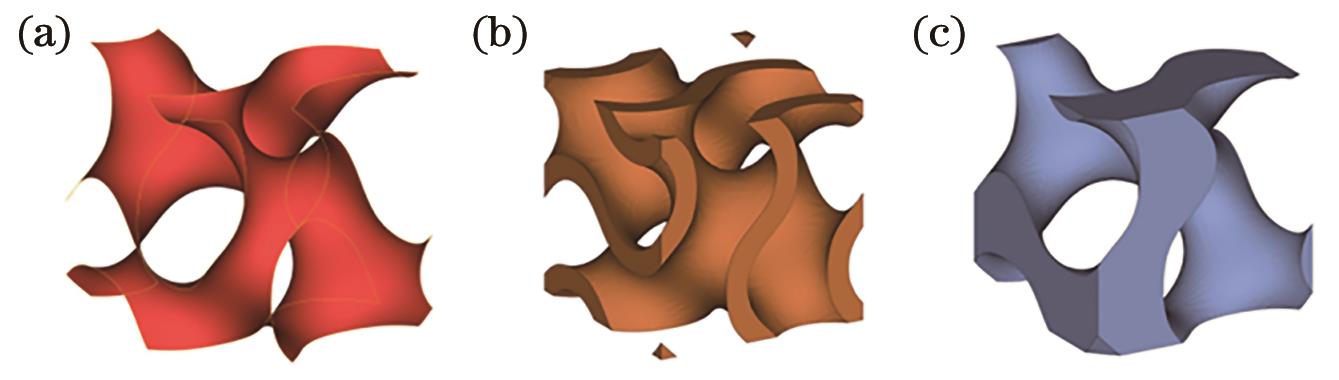
Fig. 1. Gyroid surface and structures. (a) Minimal surface; (b) G-sheet lattice structure; (c) G-solid lattice structure

Fig. 2. Gyroid lattice structure models. (a) G-sheet unit cell; (b) G-solid unit cell; (c) G-sheet multi-cell; (d) G-solid multi-cell
Fig. 3. NiTi alloy powder. (a) Powder morphology; (b) particle size distribution
Fig. 4. Schematic diagram of scanning strategy for lattice structure sample
Fig. 5. Lattice structure model creation process. (a) G-sheet; (b) G-solid
Fig. 6. Gyroid lattice structure compression simulation setup. (a) Abaqus simulated Gyroid lattice structure assembly diagram; (b) uniaxial tensile stress-strain curve of NiTi alloy at room temperature; (c) size diagram of uniaxial tensile specimen of NiTi alloy
Fig. 7. Force versus displacement
Fig. 8. Physical diagram of SLM formed samples with G-sheet and G-solid lattice structures
Fig. 9. Local morphologies of SLM formed lattice structure samples. (a) G-sheet; (b) G-solid
Fig. 10. Surface morphologies of SLM formed G-sheet and G-solid lattice structure samples. (a) G-sheet; (b) G-solid
Fig. 11. Vertical sections in x-y plane and x-z plane of TPMS point structure reconstruction models. (a) G-sheet; (b) G-solid
Fig. 12. Phase transitions of SLM formed G-sheet and G-solid lattice structure samples. (a) Phase composition; (b) phase transition temperature
Fig. 13. Mechanical properties of G-sheet and G-solid lattice structures. (a) Stress-strain curve; (b) compression modulus, nominal yield strength, and ultimate yield strength
Fig. 14. Unit cell models of Gyroid lattice structures and cross sections of their connection areas. (a) Unit cell model of G-sheet and G-solid lattice structure; (b) cross section at minimum diameter of connection region between two unit cells
Fig. 15. Images of lattice structures under different strain levels in uniaxial compression experiment. (a) G-sheet; (b) G-solid
Fig. 16. Energy absorption performance of G-sheet and G-solid lattice structures. (a) Energy absorption efficiency curves; (b) energy absorption per unit volume during compression
Fig. 17. SEM images of fractures of two Gyroid lattice structures. (a)‒(c) G-sheet; (d)‒(f) G-solid
Fig. 18. Simulated stress distributions of G-sheet and G-solid lattice structures. (a) G-sheet; (b) G-solid
|
Table 1. Parameters of different types of Gyroid lattice structure models
|
Table 2. Chemical compositions of NiTi alloy powder
|
Table 3. NiTi material properties
|
Table 4. Sizes of different types of Gyroid lattice structure samples formed by SLM


Set citation alerts for the article
Please enter your email address

© Copyright 2018-2021 | Chinese Laser Press. All Rights Reserved 沪ICP备15018463号-20