• Laser & Optoelectronics Progress
  • Vol. 62, Issue 3, 0314002 (2025)
Bin Zhou*, Xiashuang Li, Guifeng Li, Kai Sun..., Dongxu Zhang and Yibo Tang|Show fewer author(s)
Author Affiliations
  • School of Mechanical and Electrical Engineering, Shaanxi University of Science and Technology, Xi'an 710021, Shaanxi , China
  • show less
    DOI: 10.3788/LOP241050 Cite this Article Set citation alerts
    Bin Zhou, Xiashuang Li, Guifeng Li, Kai Sun, Dongxu Zhang, Yibo Tang. TA1 Surface-Traceable DM Code Marking Based on Low-Power Laser Nitriding[J]. Laser & Optoelectronics Progress, 2025, 62(3): 0314002 Copy Citation Text show less
    Laser nitriding device and sample display. (a) Schematic diagram of laser nitriding gas chamber; (b) pure titanium surface laser nitriding sample
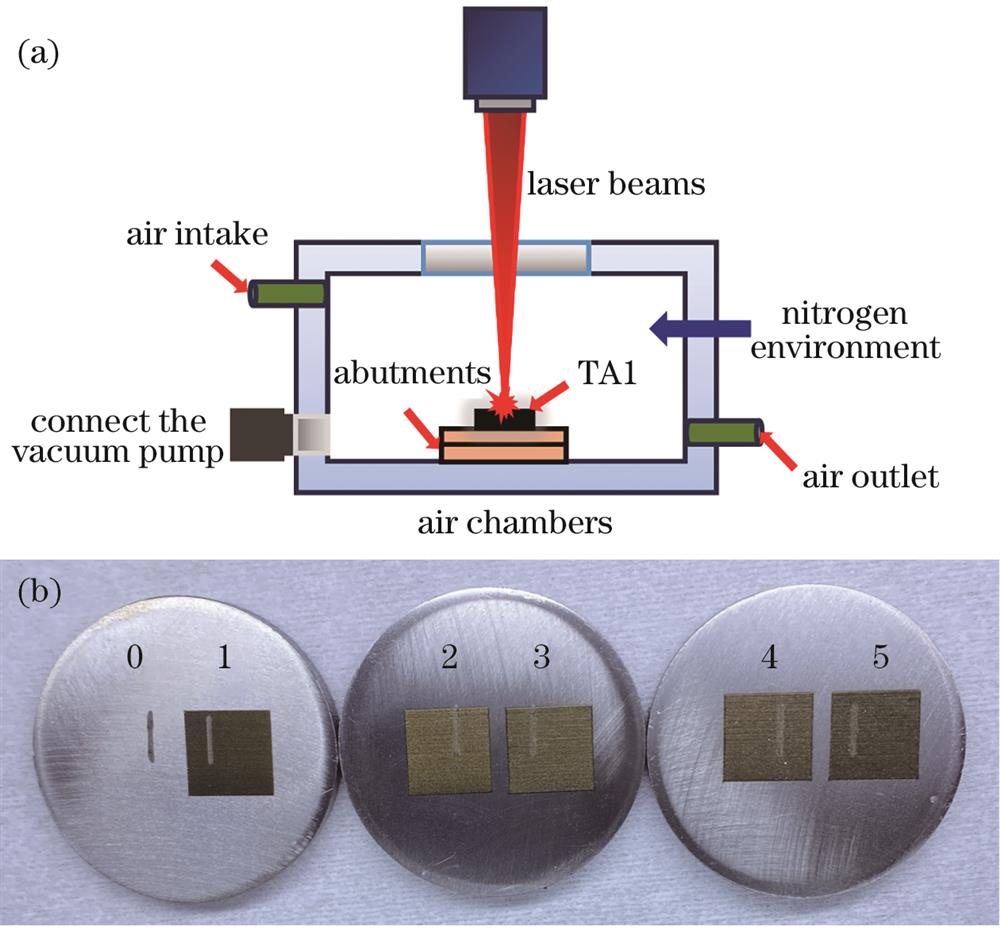
    Fig. 1. Laser nitriding device and sample display. (a) Schematic diagram of laser nitriding gas chamber; (b) pure titanium surface laser nitriding sample
    SEM morphology diagrams of laser nitriding samples. (a) S-1; (b) S-2; (c) S-3; (d) S-4; (e) S-5; (f) XRD results of matrix and S-1
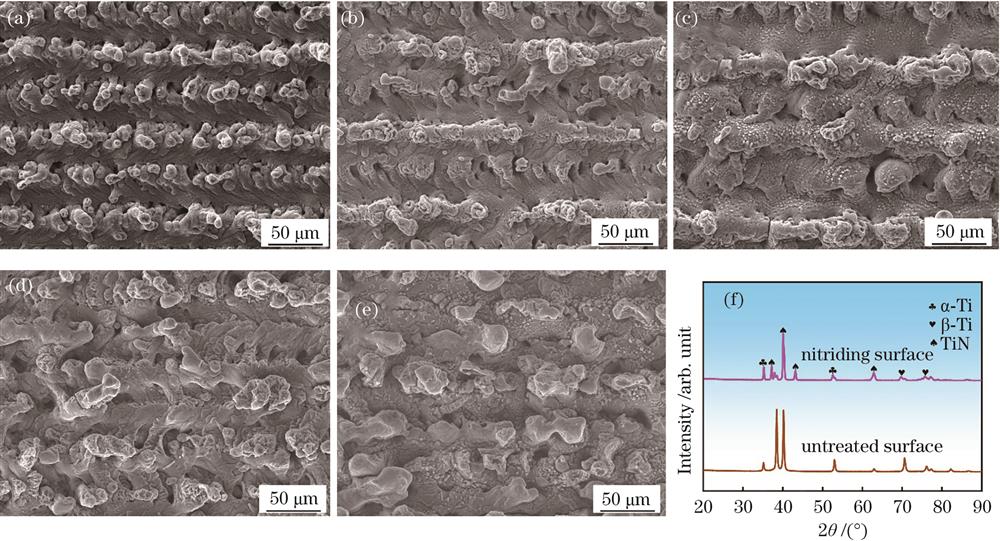
    Fig. 2. SEM morphology diagrams of laser nitriding samples. (a) S-1; (b) S-2; (c) S-3; (d) S-4; (e) S-5; (f) XRD results of matrix and S-1
    Cross-sectional morphology of nitride layer and line scan results of N element under different laser process parameters. (a) S-1; (b) S-2; (c) S-3; (d) S-4; (e) S-5
    Fig. 3. Cross-sectional morphology of nitride layer and line scan results of N element under different laser process parameters. (a) S-1; (b) S-2; (c) S-3; (d) S-4; (e) S-5
    Nitride layer thickness at different laser powers
    Fig. 4. Nitride layer thickness at different laser powers
    Two-dimensional profile curves of surface hardness and wear marks of each sample. (a) Surface hardness; (b) two-dimensional profile curves of wear marks
    Fig. 5. Two-dimensional profile curves of surface hardness and wear marks of each sample. (a) Surface hardness; (b) two-dimensional profile curves of wear marks
    3D topography of laser nitriding sample after abrasion test. (a) S-0; (b) S-1; (c) S-2; (d) S-3; (e) S-4; (f) S-5
    Fig. 6. 3D topography of laser nitriding sample after abrasion test. (a) S-0; (b) S-1; (c) S-2; (d) S-3; (e) S-4; (f) S-5
    Image of wear marks and coefficient of friction curves of laser nitriding specimens
    Fig. 7. Image of wear marks and coefficient of friction curves of laser nitriding specimens
    Sample friction coefficient trend and depth and width of wear marks. (a) Trend of friction coefficient of sample; (b) depth and width of wear marks
    Fig. 8. Sample friction coefficient trend and depth and width of wear marks. (a) Trend of friction coefficient of sample; (b) depth and width of wear marks
    (a) Wear volume and (b) wear amount of each sample with loading load of 2 N and loading time of 20 min
    Fig. 9. (a) Wear volume and (b) wear amount of each sample with loading load of 2 N and loading time of 20 min
    Schematic diagram of QR code calibrator (a) and filling mode inside the DM code module and the"module indentation compensation"(b)
    Fig. 10. Schematic diagram of QR code calibrator (a) and filling mode inside the DM code module and the"module indentation compensation"(b)
    Boundary diffusion during laser marking and making QR code. (a) Schematic diagram of boundary diffusion; (b) QR code for laser marking
    Fig. 11. Boundary diffusion during laser marking and making QR code. (a) Schematic diagram of boundary diffusion; (b) QR code for laser marking
    DM code reading quality. (a) X/Y direction printing growth; (b) contrast
    Fig. 12. DM code reading quality. (a) X/Y direction printing growth; (b) contrast
    Surface scratches and friction coefficient curves of DM codes. (a) Surface scratches; (b) friction coefficient curves
    Fig. 13. Surface scratches and friction coefficient curves of DM codes. (a) Surface scratches; (b) friction coefficient curves
    Comparison of scratches on the surface of laser marking DM codes in atmospheric environment and nitrogen-filled environment. (a) Atmospheric environment; (b) nitrogen-filled environment
    Fig. 14. Comparison of scratches on the surface of laser marking DM codes in atmospheric environment and nitrogen-filled environment. (a) Atmospheric environment; (b) nitrogen-filled environment
    SampleScanning rate /(mm/s)Laser power /WFrequency of scans /kHzLine spacing /mm
    S-0----
    S-1258400.03
    S-22510400.03
    S-32512400.03
    S-42514400.03
    S-52516400.03
    Table 1. Preparation parameters of nitriding samples
    SampleC /%N /%Ti /%Total /%
    S-16.25±0.056.14±0.0787.60±0.24100
    S-24.20±0.037.03±0.0688.77±0.20100
    S-34.25±0.0410.47±0.0885.28±0.21100
    S-45.71±0.0512.73±0.1181.56±0.26100
    S-52.75±0.0316.79±0.0980.46±0.21100
    Table 2. Mass fraction of elements of each sample line scan
    SampleSurface Vickers hardness /HV0.5k /mm3/Nm)
    S-0268.194.16
    S-1392.682.96
    S-2449.261.53
    S-3588.590.70
    S-4643.860.76
    S-5700.530.60
    Table 3. Average Vickers hardness and dimensional wear coefficient on the sample surface
    Bin Zhou, Xiashuang Li, Guifeng Li, Kai Sun, Dongxu Zhang, Yibo Tang. TA1 Surface-Traceable DM Code Marking Based on Low-Power Laser Nitriding[J]. Laser & Optoelectronics Progress, 2025, 62(3): 0314002
    Download Citation