
Zhongyi YANG, Mai LU. Safety assessment of electromagnetic exposure from a 13.56 MHz RF anti-theft device[J]. Journal of Radiation Research and Radiation Processing, 2024, 42(5): 050601
Journals >Journal of Radiation Research and Radiation Processing >Volume 42 >Issue 5 >Page 050601 > Article
- Journal of Radiation Research and Radiation Processing
- Vol. 42, Issue 5, 050601 (2024)
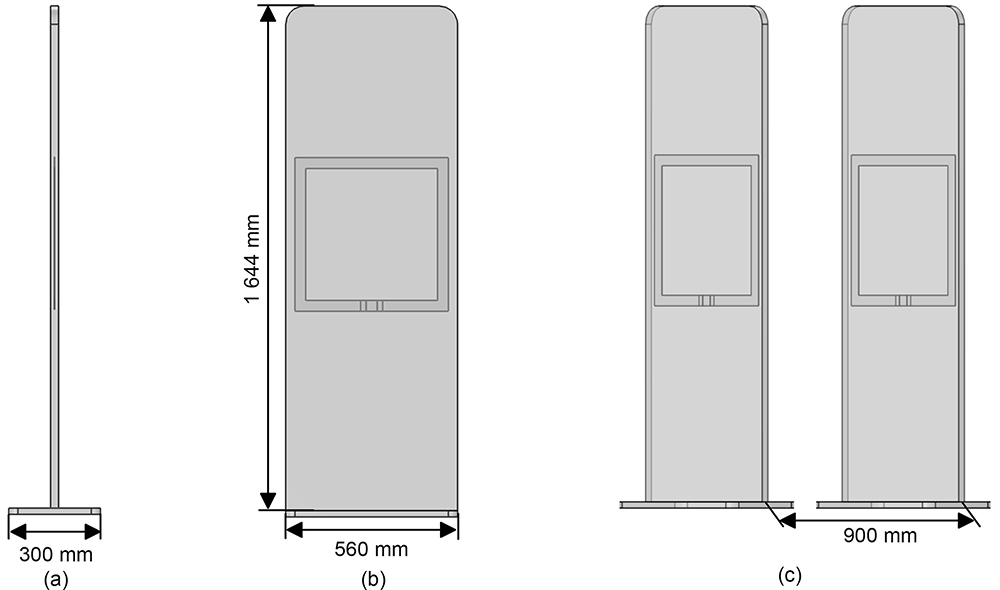
Fig. 1. RF anti-theft device model: (a) side view of anti-theft door panel; (b) front view of anti-theft door panel;

Fig. 2. Loop antenna system
Fig. 3. Magnetic field distribution between YZ plane antennas
Fig. 4. Validity verification results: (a) parallel X-axis magnetic field intensity distribution; (b) parallel Y-axis magnetic field intensity distribution (color online)
Fig. 5. Model of human body
Fig. 6. Simulation diagrams of exposure scenarios in different standing positions: (a) right in the middle; (b) right in front of the center 25 cm
Fig. 7. Distribution of human electric field intensity and magnetic field intensity at 100 mW: (a) electric field intensity at position A; (b) magnetic field intensity at position A; (c) electric field intensity at position B; (d) magnetic field intensity at position B
Fig. 8. Human SAR value distribution at 100 mW: (a) SAR value of specific absorptivity at position A; (b) SAR value of specific absorptivity at position B
Fig. 9. Human head SAR value distribution at position A at 100 mW: (a) scalp; (b) skull; (c) brain; (d) head section
Fig. 10. Human head SAR value distribution at position B at 100 mW: (a) scalp, (b) skull, (c) brain, (d) head section
Fig. 11. Distribution of human electric field intensity and magnetic field intensity at 1 W: (a) electric field intensity at position A; (b) magnetic field intensity at position A; (c) electric field intensity at position B; (d) magnetic field intensity at position B
Fig. 12. Human SAR value distribution at 1 W: (a) position A ratio of absorptivity SAR; (b) position B ratio of absorptivity SAR
Fig. 13. Human head SAR value distribution at position A at 1 W: (a) Scalp; (b) Skull; (c) Brain; (d) Head section
Fig. 14. Human head SAR value distribution at position B at 1 W: (a) scalp; (b) skull; (c) brain; (d) head section
|
Table 1. Public electromagnetic exposure limits of 13.56 MHz time-varying electromagnetic fields
|
Table 2. Comparison of E, H, SAR and ICNIRP limits of tissues in position A of the human body
|
Table 3. Comparison of E, H, SAR and ICNIRP limits of tissues in position B


Set citation alerts for the article
Please enter your email address

© Copyright 2018-2021 | Chinese Laser Press. All Rights Reserved 沪ICP备15018463号-20