
Yuyi Li, Yue Gan, Ben Niu, Jing Huang, Qiuqiang Zhan. Noncoherent Raman Spectroscopy and Its Biomedical Application (Invited)[J]. Laser & Optoelectronics Progress, 2024, 61(6): 0618009
- Laser & Optoelectronics Progress
- Vol. 61, Issue 6, 0618009 (2024)
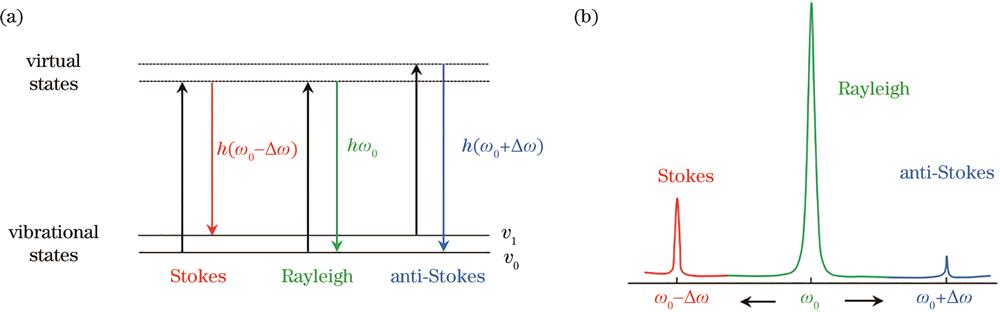
Fig. 1. (a) Schematic diagram of energy level structures for Rayleigh scattering and Raman scattering processes; (b) schematic diagram of Rayleigh scattering and Raman scattering spectra
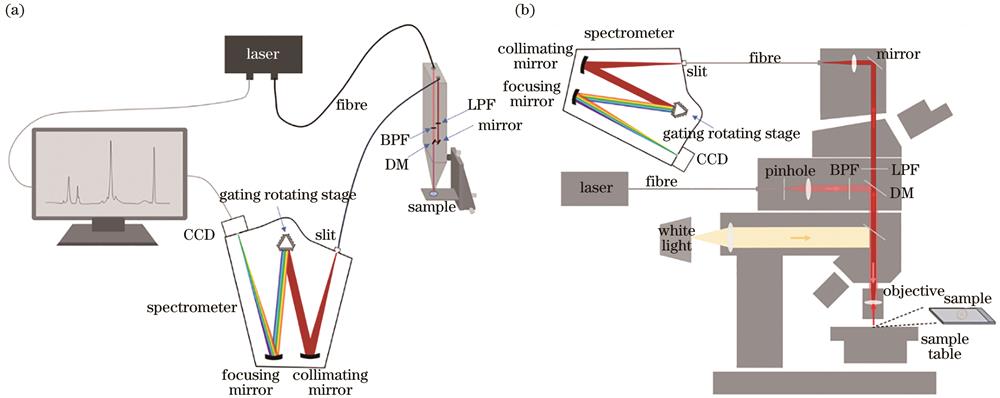
Fig. 2. (a) Schematic diagram of a handheld Raman spectroscopy detection system; (b) schematic diagram of confocal Raman microscopy system
Fig. 3. Localized surface plasmon resonance[13]
Fig. 4. Electric field enhancement mechanism of SERS[13]
Fig. 5. Chemical enhancement mechanism of SERS, modified from reference [16]. (a) The non resonant enhancement between the tested molecule and metal nanoparticles is independent of excitation; (b) resonance enhancement formed by laser energy and electronic transitions within the tested molecule; (c) class resonance enhancement of photo induced charge transfer
Fig. 6. Precious metal nanoparticles with different geometric structures. (a) Spherical[25]; (b) rod-shaped[26]; (c) triangular[27]; (d) star-shaped[28]; (e) cage[29]; (f) core-shell cage[30]
Fig. 7. General process of Raman spectroscopy data processing
Fig. 8. Workflow of machine learning[54]
Fig. 9. Three common neural network models. (a) Multilayer perceptrons, convolutional neural networks, and deep tensor neural networks[60]; (b) composition of convolutional neural network[61]
Fig. 10. The application of incoherent Raman microscopy spectroscopy technology at the cellular level. (a) H&E staining maps, protein and lipid distribution maps, as well as spontaneous Raman spectra and classical least squares fitting of normal colon tissue (upper) and cancerous colon tissue (lower)[63]; (b) SERS immunoassay principle diagram for epithelial mesenchymal transition[64]; (c) a blood biochemical map drawn at the cellular level using spontaneous Raman microscopy spectroscopy[65]; (d) mapping metabolic changes in endothelial cells using spontaneous Raman probes[66]
Fig. 11. Application of Raman microscopy spectroscopy technology at the tissue level. (a) SERS spectrum, SERS imaging, and photoacoustic imaging images of tumor tissue in breast cancer mouse model[74]; (b) single and multiple SERS imaging detection of coronary artery endothelial cell tissue[75]
Fig. 12. The application of Raman microspectral technology in body fluid biopsy. (a) Schematic diagram of SERS technology combined with artificial intelligence using exosomes in plasma to detect various cancers[89]; (b) schematic diagram of the preparation process of saliva protein silver nanoparticles mixture, and comparison of SERS spectra of the mixture with saliva protein and silver nanoparticles without silver[90]


Set citation alerts for the article
Please enter your email address

© Copyright 2018-2021 | Chinese Laser Press. All Rights Reserved 沪ICP备15018463号-20