
Ilia Artser, Maksim Melnik, Anton Tcypkin, Igor Gurov, Sergei Kozlov, "Wave interference under self-phase modulation and triple frequency generation owing to few-cycle terahertz pulses propagating in a cubic nonlinear medium," Chin. Opt. Lett. 23, 021901 (2025)
- Chinese Optics Letters
- Vol. 23, Issue 2, 021901 (2025)
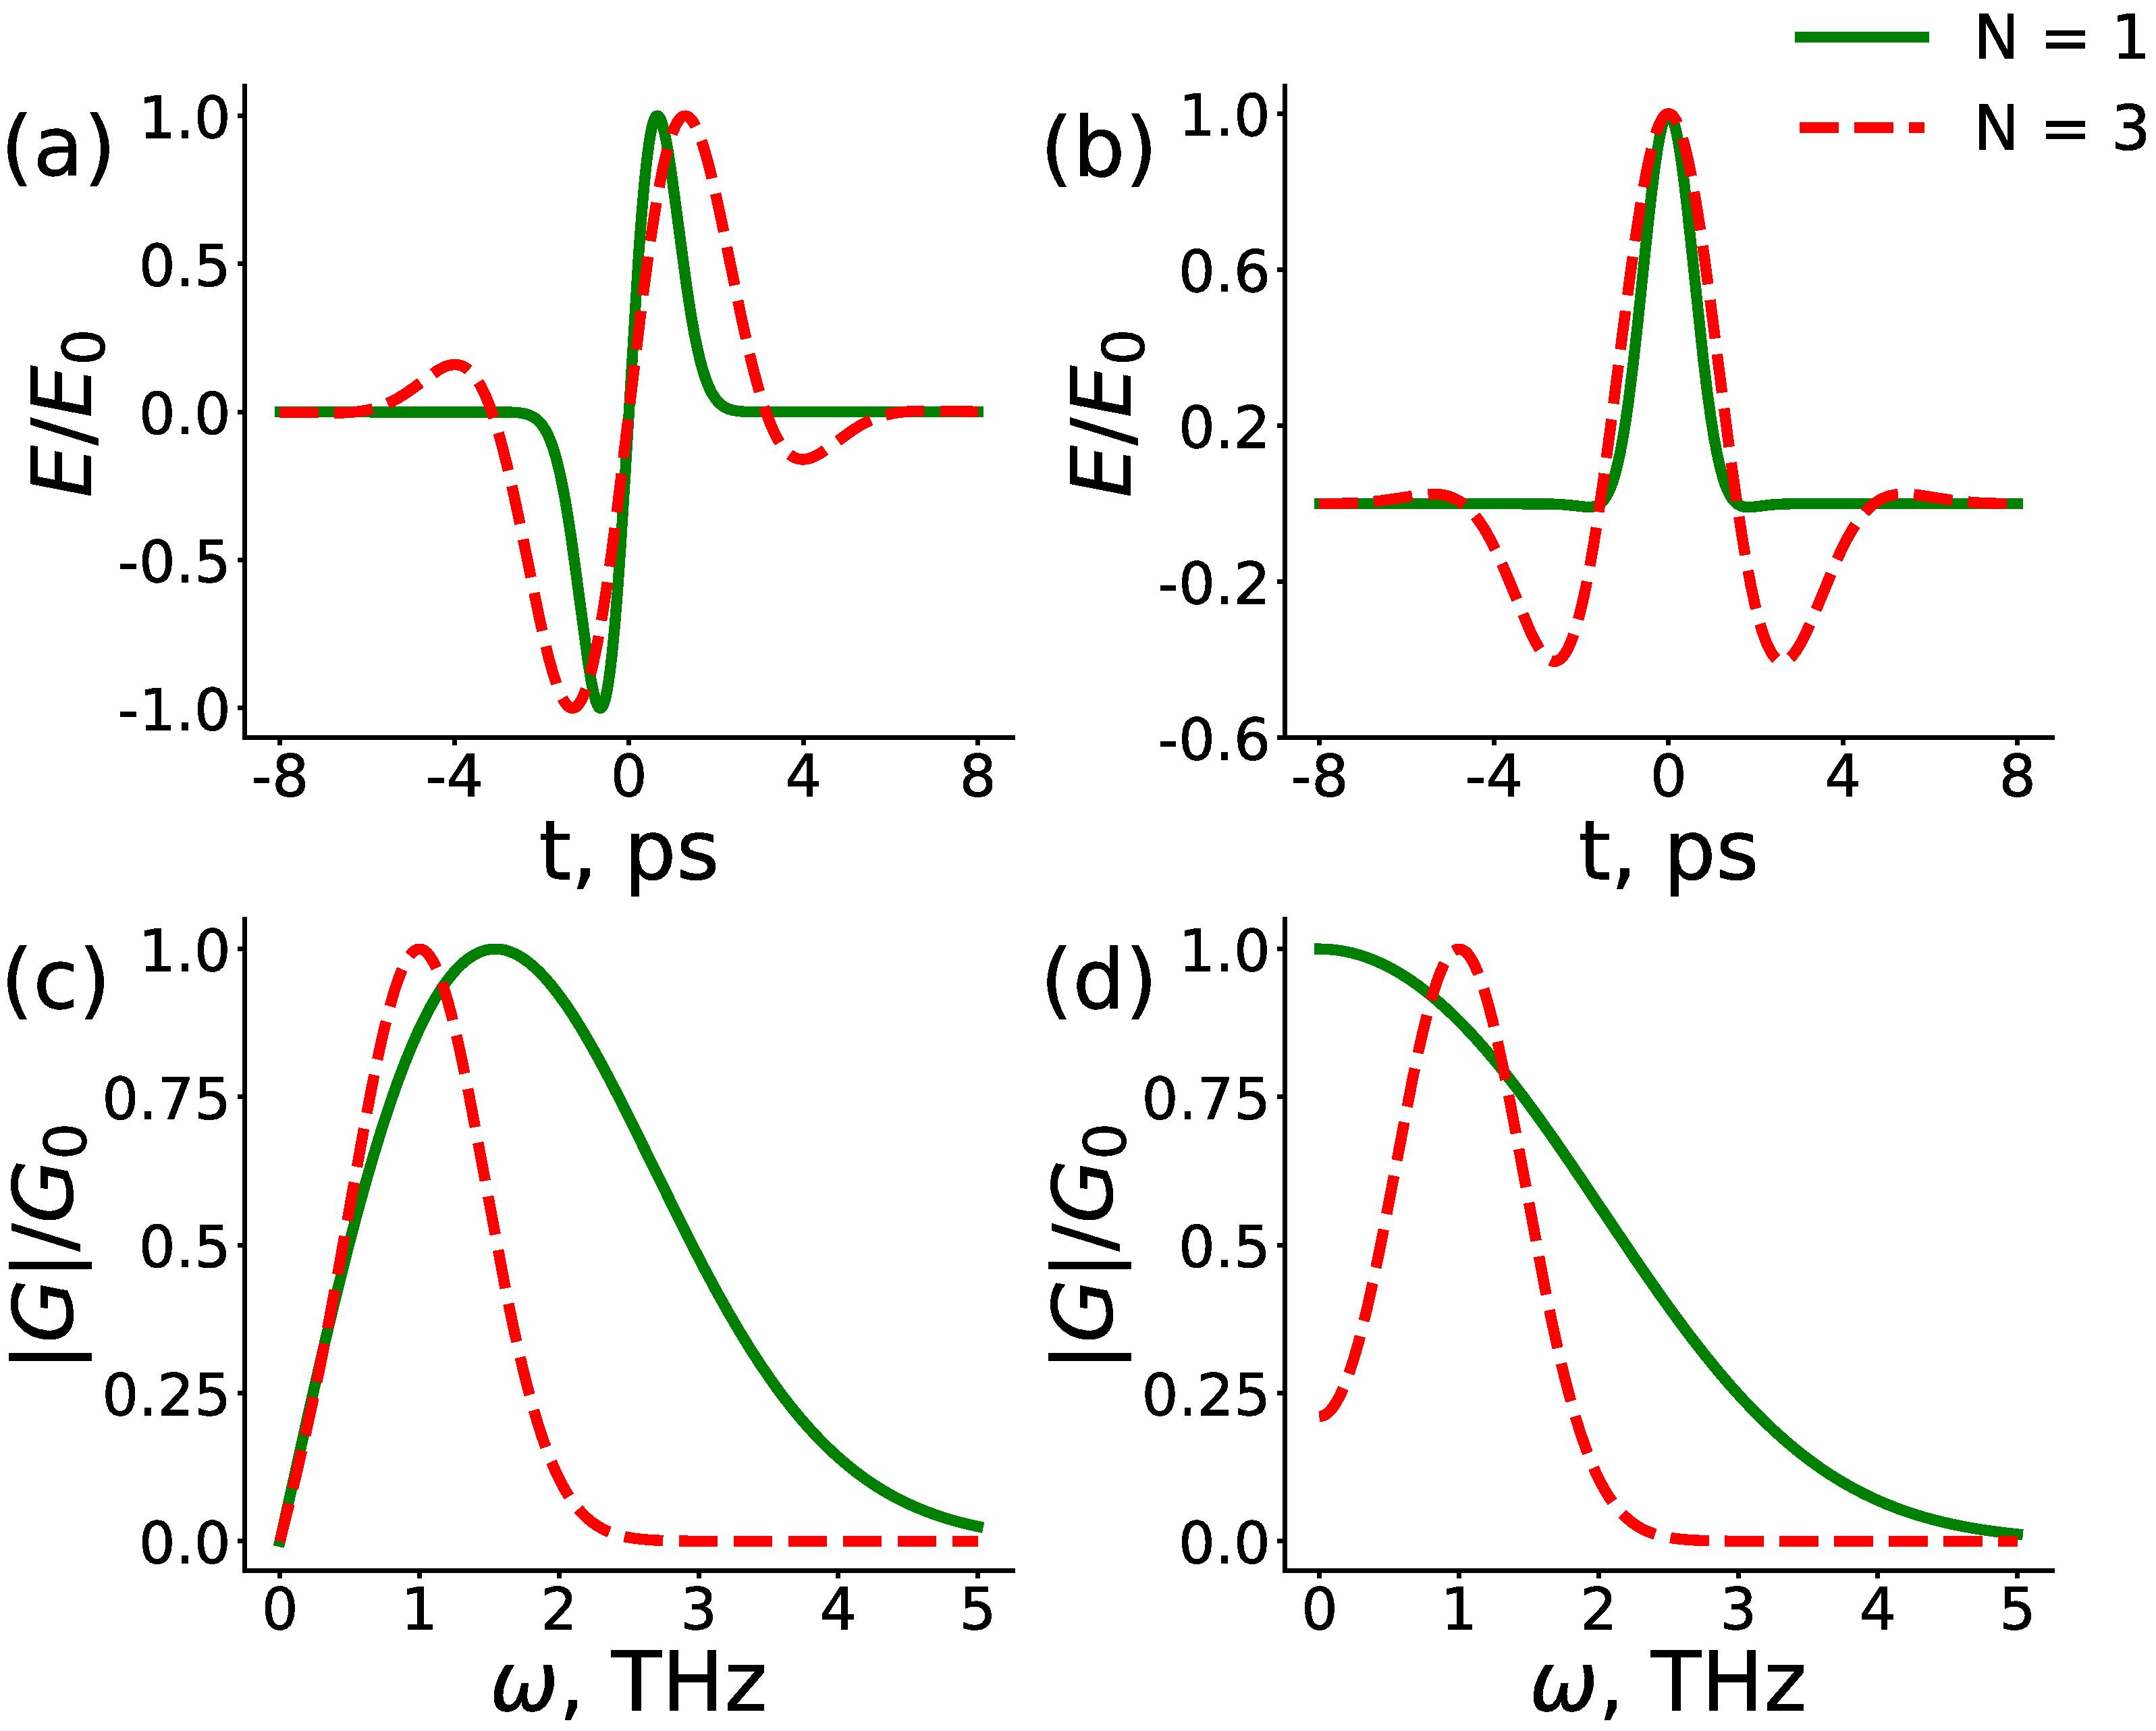
Fig. 1. Dependence of the normalized pulse field at the entrance to the nonlinear medium, specified by sine-like (a) and cosine-like (b) functions, on the time for various values of the oscillation number in the pulse N. Corresponding dependencies of the normalized spectra on frequency (c) and (d). Pulse shapes with N equals 1 (green solid curves) and N equals 3 (red dashed curves).
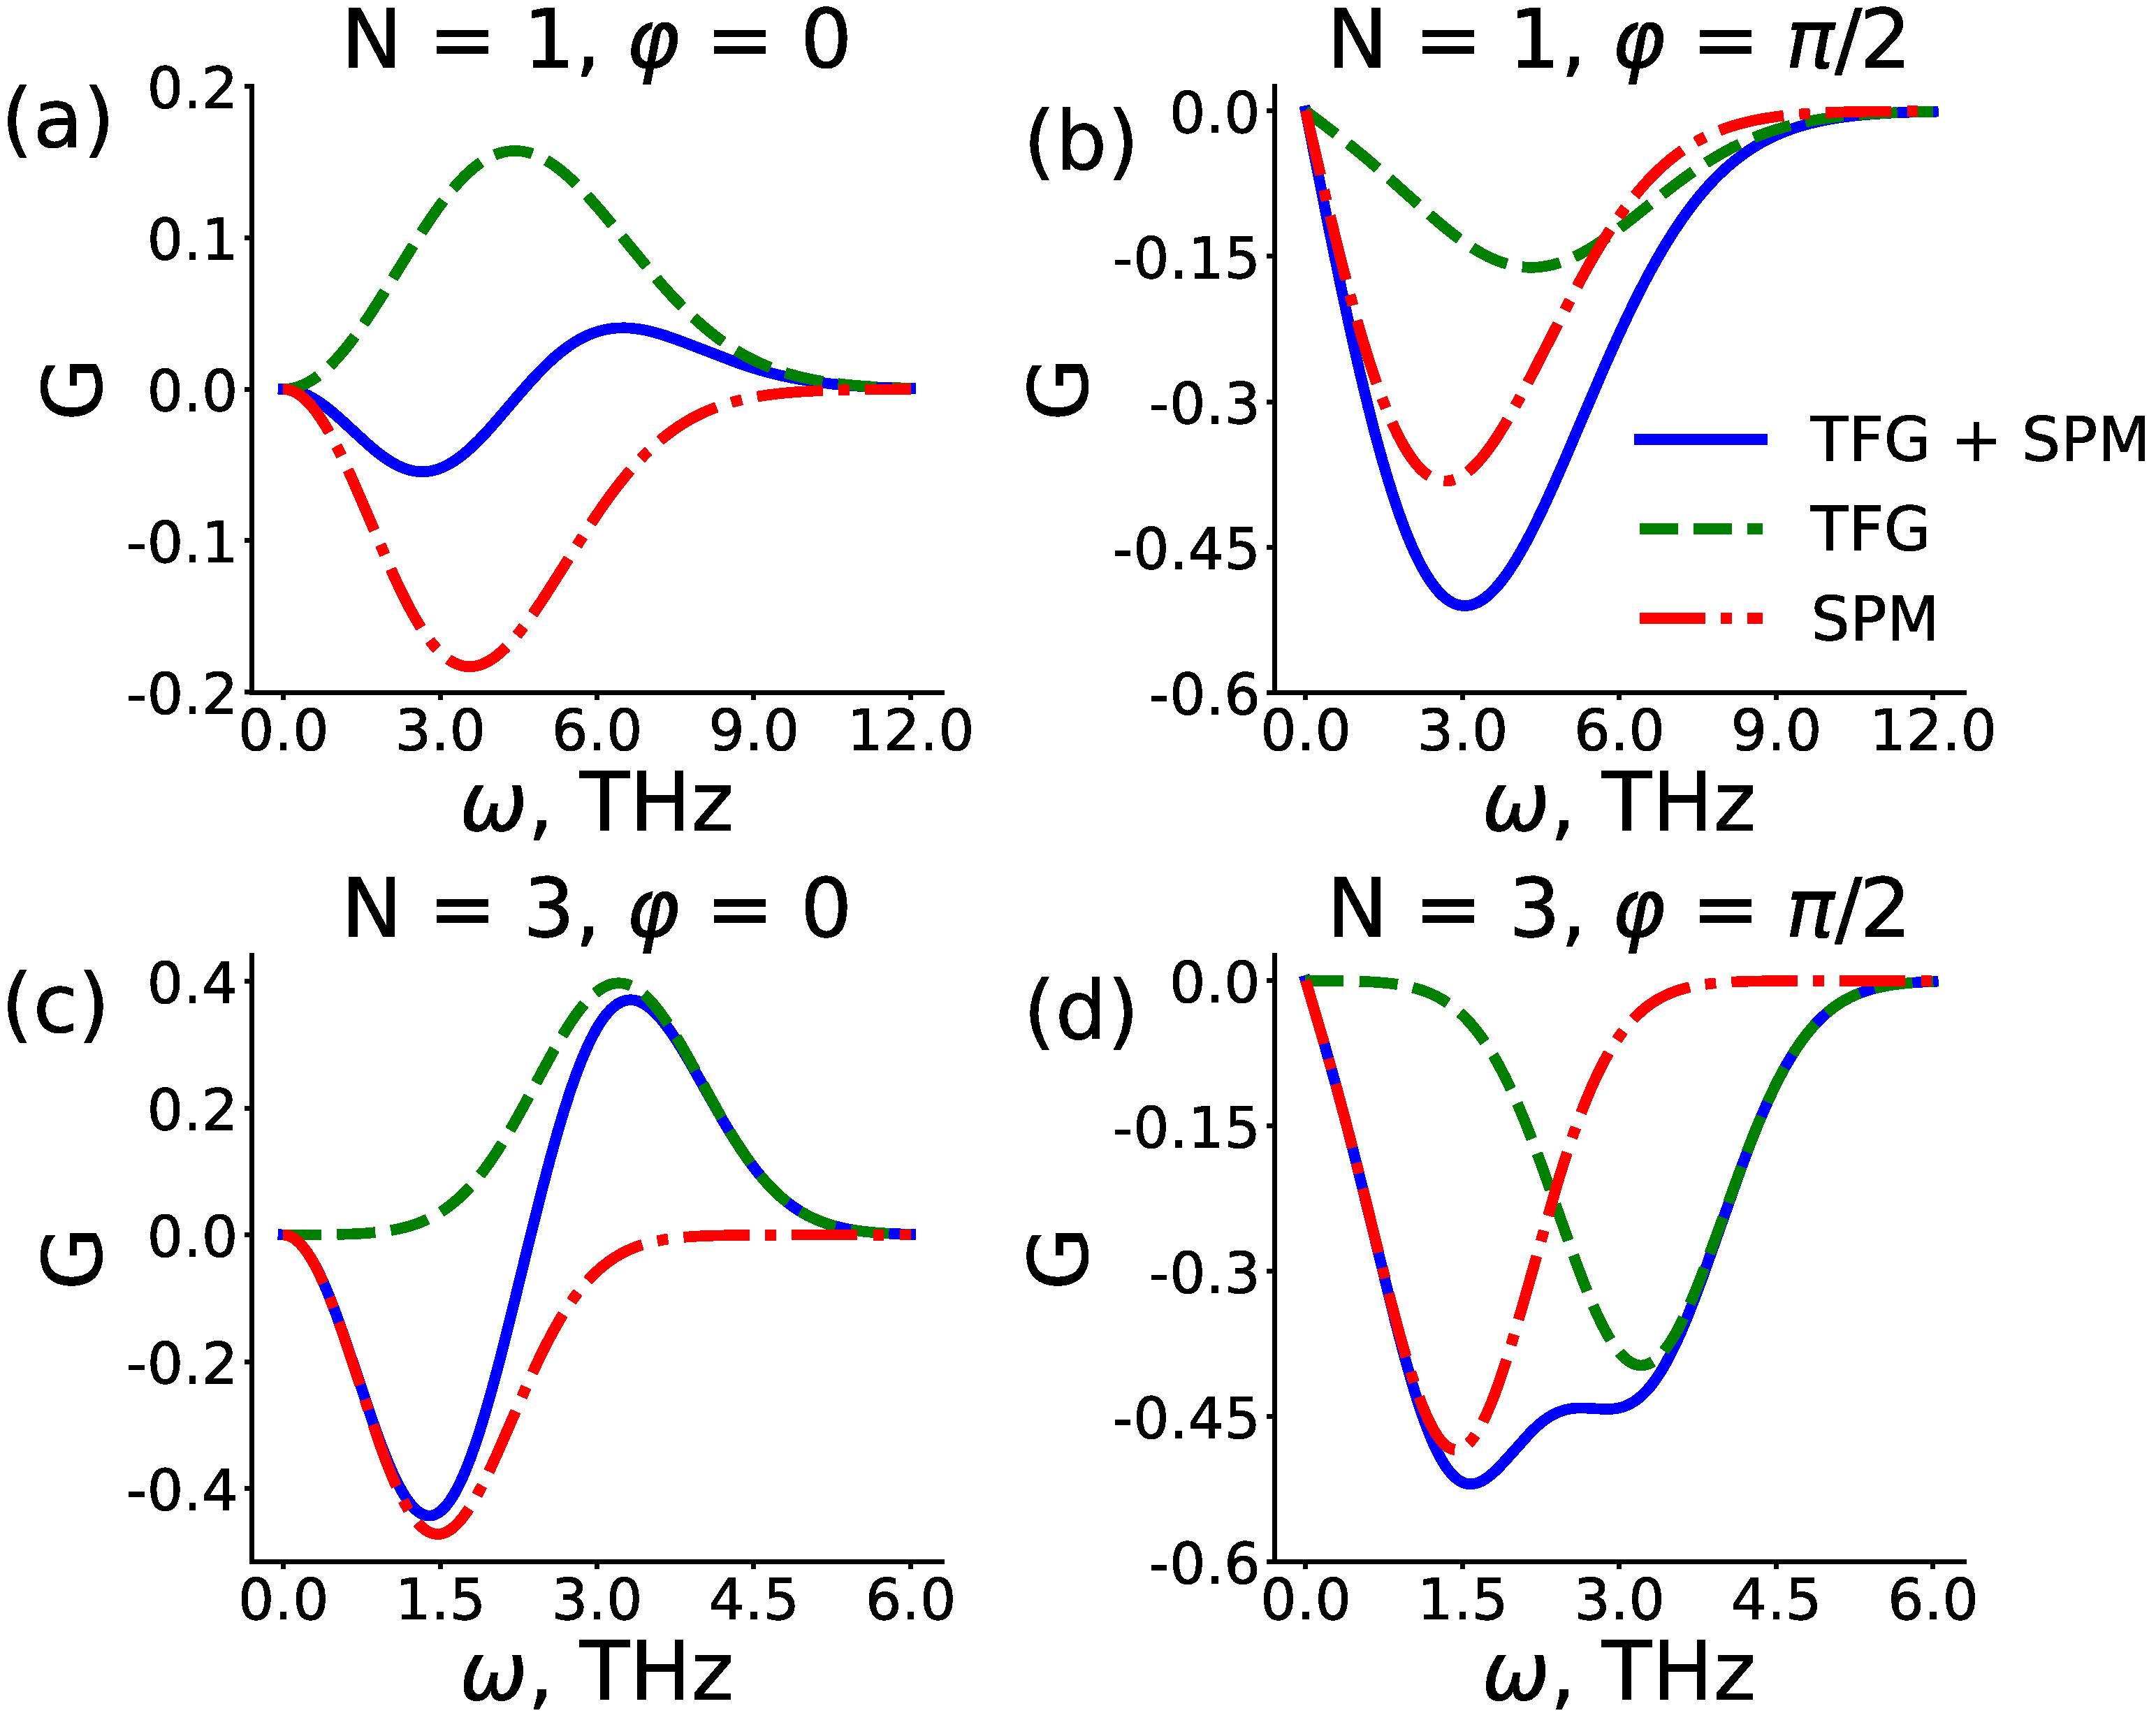
Fig. 2. Spectra of TFG, SPM, and their sums as a function of frequency for pulses at the entrance to the nonlinear medium specified by sine-like (a) and (c) and cosine-like functions (b) and (d). The negative values of the SPM spectra in (a) and (c) are due to the presence of a phase shift of π, which also results in the negative values in the sum of the SPM and TFG spectra. The spectra of TFG are marked in green, SPM in red, and their sums in blue.
Fig. 3. Pulses of TFG, SPM, and their sums as a function of time for pulses at the entrance to the nonlinear medium specified by sine-like [(a) and (c)] and cosine-like [(b) and (d)] functions. The pulses of TFG are marked in green, SPM in red, and their sums in blue.
Fig. 4. Dependence of the overlap coefficient s on the number of oscillations in the pulse N for different CEP values φ (a) and on CEP values φ for different N values (b).
Fig. 5. The dependence of the mutual influence coefficient of TFG and SPM on CEP φ for different values of N (N = 1 is the solid orange curve, N = 3 is the green dashed curve, and N = 5 is the purple dashed-dotted curve).
Fig. 6. Theoretical curve versus experimental curve. Blue solid curves represent experimental data; red dashed curves are for simulation. (a) and (b) demonstrate pulse curves while (c) and (d) for spectrum curves. (a) and (c) demonstrate experimental results obtained in Ref. [17] and the simulation with the experimental parameters. A similar is completed for (b) and (d) for experimental data from[16].


Set citation alerts for the article
Please enter your email address

© Copyright 2018-2021 | Chinese Laser Press. All Rights Reserved 沪ICP备15018463号-20