 AI Video Guide
  AI Picture Guide
 AI One Sentence

Yi-Feng Li, Zhi-Ang Hu, Jia-Wei Gao, Yi-Sheng Zhang, Peng-Fei Li, Hai-Zhou Du. Efficient anomaly detection method for offshore wind turbines[J]. Journal of Electronic Science and Technology, 2024, 22(4): 100285
- Journal of Electronic Science and Technology
- Vol. 22, Issue 4, 100285 (2024)
Note: This section is automatically generated by AI . The website and platform operators shall not be liable for any commercial or legal consequences arising from your use of AI generated content on this website. Please be aware of this.
Abstract
1 Introduction
With the increasing global utilization of renewable energy, the installed capacity of offshore wind power is also growing steadily, making the maintenance of offshore wind turbines an issue that cannot be ignored. Offshore wind turbines, in particular, entail maintenance difficulties and costs several times higher than their onshore counterparts. Detecting the operational status of offshore wind turbines and promptly identifying anomalous data are crucial for maintaining offshore wind turbines. Based on actual wind turbine operational data, non-intrusive anomaly detection can be realized, and the results can be fed back in time through the network. Deploying anomaly detection algorithms to analyze operational data is highly beneficial for maintenance operations. It enables the timely identification of anomalies, facilitating prompt turbine maintenance and minimizing the potential for larger losses resulting from abnormal conditions.
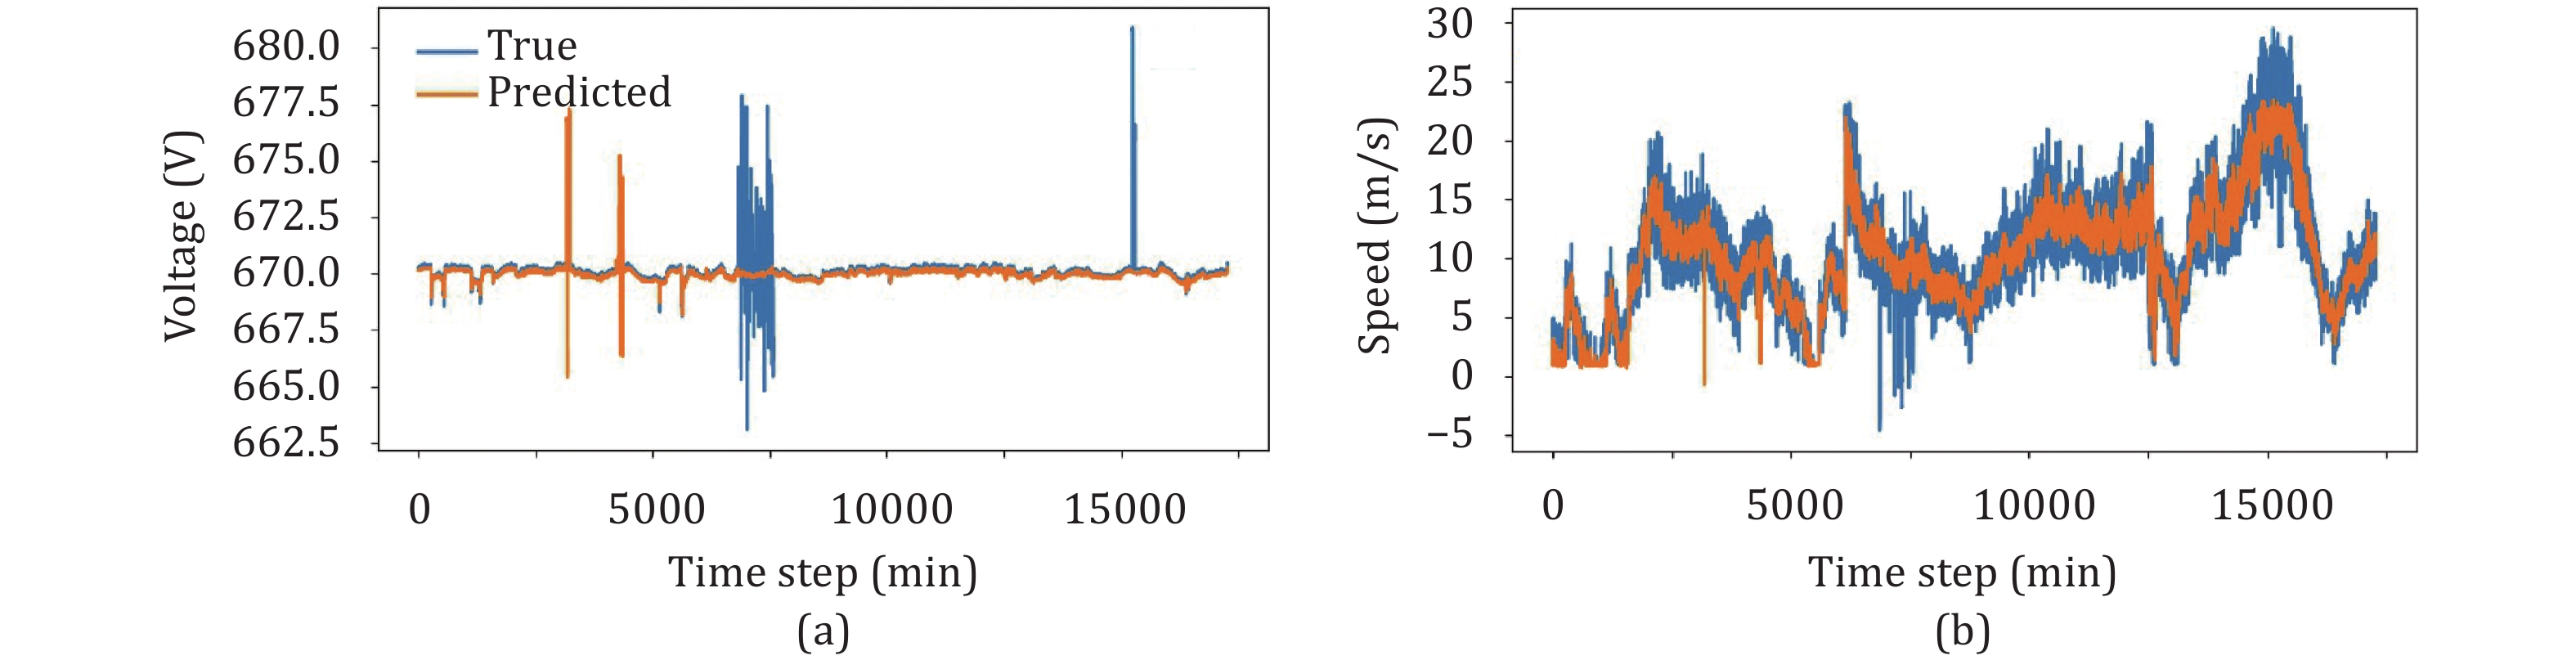
Anomalies are rare in real-world time-series data [1], offshore wind turbines are generally only serviced for maintenance on a regular schedule or when there are clear system failures such as shutdowns or going offline. Determining how to identify anomalous data in daily operational data and provide early warnings is a worthwhile research topic [2]. Due to the scarcity of labeled data for anomalous samples, unsupervised machine learning is often used for anomaly detection in time-series data. Deep learning time-series anomaly detection technologies can be categorized into two types: Reconstruction-based [3] and prediction-based methods. Reconstruction-based methods assume that normal data points conform to a specific probability distribution. Consequently, anomalies are those points that deviate this distribution. On the other hand, prediction-based methods train a model to forecast future values or impute missing data, and then the points with large prediction errors are recognized as anomalies. Both reconstruction-based and prediction-based methods are based on the premise that the model should effectively reconstruct normal data. The challenge addressed in this text involves two key aspects: How to locate anomalies by comparing actual data with the data reconstructed or predicted by the model. Fig. 1 shows the true and predicted values of voltage and wind speed for the real-world offshore wind turbine operational dataset, and it is evident that the difference between the true and predicted values is remarkable. The variation difference and magnitude of the two features on the data scale are also different.
![]()
Figure 1.Two examples on the real-world offshore wind turbine operational dataset: (a) contrastive of L1L2 line voltage and (b) contrastive of wind speed (mechanical).
Challenge 1: The setting of thresholds is often based on subjective judgment or experience, which may be not applicable to all datasets or application scenarios. Moreover, in multivariate environments, there may be complex interdependency among variables, which makes the accurate calculation of residuals and setting of thresholds more complex. Improper setting of thresholds can lead to inaccurate model predictions, thus failing to accurately identify anomalies or misrecognizing normal values as anomalies. A too high threshold results in false negatives (missing anomalies), while a too low threshold leads to false positives (erroneous alarms).
Challenge 2: Changes in the data scale and distribution have more significant influence on multivariate datasets compared with univariate ones. How to unify the data scales of different features across various time scales is a tricky issue. Because they vary across different features, and even the distribution of the same feature differs across different periods. Training with these raw data may result in slow convergence, decreased performance, or overreliance on a single feature due to large data scale disparities.
While detecting anomalies in offshore wind turbines, the data captured by multiple detectors needs to be judged. Because data characteristics of these detectors are different for a short period of time and a long period of time, in an offshore environment with extreme climate variations. Conventional methods usually suffer from curse of dimensionality and feature capture failures on multi-scale, multi-dimensional features. In this paper, we propose a novel unsupervised anomaly detection algorithm, Hawkeye, to alleviate the limitation on capturing multi-dimensional and multi-scale features and anomaly detection. Unlike current prediction-based anomaly detection methods, Hawkeye innovatively combines multivariate data prediction with the residual clustering process, which can effectively capture anomalies in multivariate datasets. The main contributions of this study can be summarized as follows:
1) The anomaly detection is significantly improved by clustering the residuals. The proposed approach endows prediction-based methods once again the state-of-the-art, which is especially desired because this kind of method has better interpretability.
2) An automatic labeling technique is proposed to label anomalous data. Based on the normalized residuals of the data, the proposed method can also pre-determine the data contamination expectation, thus realizing the automatic labeling of anomalous data.
3) The best performance is achieved by the proposed Hawkeye method, to the best of our knowledge, with 14% higher F1-score on the public dataset than that of Isolation Forest. This unsupervised anomaly detection is also viable on a real-world offshore wind turbine dataset, and the detection results are consistent with the offshore wind turbine overhaul reports.
2 Related work
As an important part of renewable energy fields, offshore wind turbines have received extensive attention and highly developed in recent years. However, due to its operational environment, wind turbine equipment is vulnerable to various factors such as extreme winds, wildlife, and grid instability, which can result in equipment malfunctions. To accurately detect these anomalies, the conventional methods are mainly based on collecting and analyzing the wind turbine operational data, including these determined by statistical values, training anomaly detection models on labeled data, and unsupervised anomaly detection models.
2.1 Conventional statistical methods
Conventional statistical methods [4–8] are widely used for anomaly detection due to their advantages such as fast computation speed, excellent performance on small sample data, and the fact that, their results are more interpretable based on clear mathematical formulas and rules, making it easier to analyze and investigate the causes of anomalies. Xu et al. [9] proposed a robust principal component analysis (PCA) algorithm to detect the contaminated high-dimensional anomaly datasets. Amazon partitions the data space by using the robust random cut forest (RRCF) method [10] to build a forest that reflects the data characteristics, thus realizing anomaly detection. The local outlier factor (LoF) [5] algorithm is proposed to evaluate the anomalous possibility of a data point by comparing its density with those of other neighboring points. Isolation Forest [7] “isolates” observations by randomly selecting features and cut-off values. Anomalies are usually easier to isolate, so fewer isolation steps are required. It evaluates the anomalous possibility by calculating the average number of steps required to isolate a point; the less the average steps, the more possibly the point is anomalous. One class support vector machine (OCSVM) [6] maps the data into a high-dimensional feature space and finds a hyperplane in this space that encapsulates all the normal data, that is, the data outside this hyperplane is anomalous. The boundary region is maximized by adjusting its position and size, thereby distinguishing between normal and anomalous data. However, these conventional statistical methods are all overly reliant on the data, which makes them much less effective when the data is of normal quality. The real-world operational data from offshore wind turbines at sea is usually not precisely labeled. As a result, it is difficult for conventional statistical methods to achieve high-efficient anomaly detection with this extremely unbalanced sample.
2.2 Supervised learning methods
Supervised learning methods [11–14] utilize labeled normal and abnormal data to train the model during the training process, which can identify and predict anomalies in unknown data. Hidden Markov model (HMM) [11] detects anomalies in time-series data by building a statistical model that incorporates state transfer and observation probabilities. When the actual observations deviate from the probability distribution predicted by the model, the model marks them as anomalies. Ryzhikov et al. [12] trained for anomaly detection by drawing pseudo-anomaly samples from low-density regions of a normalized flow model. Li et al. [15] applied a multilayer perceptron (MLP) network based on a multi-scale sampling strategy and utilized an information fusion mechanism to integrate the learned features. Hybrid Isolation Forest (HIF) [13] introduces the concept of a hybrid model, dividing the data into multiple subsets to realize anomaly detection. Supervised methods are often high-efficient in anomaly detection. However, these models also rely on labeled data, which is rare in real-world operations. Especially for anomaly detection of offshore wind turbines, field experts are required to accurately label the occurrence time and type of the anomaly before inputting it into the model for training. With such large amounts of time-series operational data, labeling training data is time-consuming and laborious.
2.3 Unsupervised learning methods
Unsupervised learning [16–23] is one of the most widely used methods in real-world anomaly detection. Most existing unsupervised time-series anomaly detection algorithms are either based on reconstructing the data with low-dimensional features and judging it by thresholding, or based on time step prediction. Reconstruction-based methods learn the representation of low-dimensional data and then try to reconstruct the normal data. However, the construction of multivariate data is much more difficult than that of univariate data. Because there are cross-correlations between multivariate variables, making it difficult to describe with low-dimensional probability distributions. In deep Isolation Forest [24], anomaly detection is performed by mapping raw data to a random representation integration via a randomly initialized neural network. Xu et al. [25] proposed pollution-tolerant, anomaly-informed learning of data normality with uncertainty modeling-based calibration and natural anomaly-based calibration. Su et al. [17] employed a gated recurrent unit (GRU) model to capture the intricate temporal dependencies within multivariate observations in the data space and leveraged a variational autoencoder (VAE) with random variable linkage techniques to detect anomalies. Wang et al. [22] also realized univariate anomaly detection of multiple indicators by VAE from the perspective of frequency. Jiang et al. proposed a generative adversarial network (GAN) based model [19], where a generator is trained to produce samples similar to the real data distribution, while an encoder is trained to encode the data into its latent representation efficiently. Anomalies are flagged by calculating the difference between the input and the output. However, the training process for reconstruction-based models is complicated. Elaborately tuning the model architecture and hyperparameters is required to make a balance between the generator and the discriminator. If the generator is too weak, the normal data distributions cannot be accurately captured; otherwise, diverse synthetic samples cannot be successfully produced. Making such a balance requires the assistance of field experts. In offshore wind turbine anomaly detection, a new unsupervised method is even more desirable. The prediction-based approach can be a good alternative. Prediction-based methods [20] try to predict the normal values of the data based on historical data and determine the anomalies based on the prediction error. Crossformer [26] utilizes cross-dimension dependencies to improve prediction accuracy, ensuring that multi-dimensional data can be accurately reduced. However, these prediction-based methods fail in a variable ocean climate with no obvious cyclic features, and anomalies cannot be correctly detected without multi-scale feature prediction methods. In this paper, we propose an approach based on residual clustering, which effectively eliminates the range inconsistency in predicted values between the variables of different scales.
3 Design of Hawkeye
3.1 Problem definition
In multivariate time-series anomaly detection, the key is to identify anomalous data or patterns in the multivariate time-series data
By using δ to denote the anomaly label obtained from Hawkeye, we have
that is,
3.2 Architecture of Hawkeye
Fig. 2 shows the architecture of Hawkeye, which consists of a cleansing module, a prediction module, and an automatic labeling module. The data cleansing module preprocesses the data and converts it into a format suitable for machine learning, where Lagrangian interpolation is adopted to fill in the missing data and normalize it further. When the training data is modeled in the prediction module, the prediction module learns the trend of the data. The trained model tries to predict the data from scratch in certain time steps. The automatic labeling module is applied to realize the automatic labeling of anomalous data. By calculating the residuals between the original data and the predicted data which will be categorized into 3 categories through clustering. The first one is those that are perfectly predicted, the second one is those with average prediction residuals, and the third one is those with extremely large prediction residuals. The data in the category with extremely large prediction residuals will be labeled as anomalous data.
![]()
Figure 2.Architecture of Hawkeye.
3.3 Cleansing module
Data cleansing is crucial during anomaly detection, especially for the anomaly detection model of Hawkeye based on reconstructing normal data. To better reproduce the missing data values of continuous variables, the Lagrangian interpolation algorithm is adopted in this paper. Let
where
Since different features often have different scales, to eliminate the influence induced by the different scales, Z-score [27] standardization is used to normalize the different features. This makes it more conducive to model learning and comparison. For a single feature, the equation for Z-score standardization is
where
3.4 Prediction module
Prediction-based anomaly detection methods are especially advantageous to real-time monitoring and automatic adaption to data changes, which is crucial for offshore wind turbine anomaly detection, cybersecurity monitoring, and other domains that require immediate response. Crossformer [26] is a common prediction-based model used to improve detection rates, especially for the high-dimensional data with complex structures. Because it can address the challenge of cross-latitude dependence in time-series forecasting. On the basis of Crossformer, we design a prediction module with a hierarchical encoder-decoder (HED) structure. In this structure, each layer represents a different time scale. The module uses the dimension-episode-wise (DSW) embedding method to capture the time-series features in the data. This method splits the time series in each dimension into multiple episodes and then embeds these episodes into the feature vector. As a result, each time series is converted into a two-dimensional matrix, where one column represents the time and the other one represents the dimension. To efficiently capture the temporal and dimensional dependencies of these two-dimensional matrices, a two-stage attention (TSA) layer is introduced to enhance the model’s understanding and prediction capabilities. In the HED structure, each layer of the encoder merges the neighboring episodes of the next layer’s output to capture the correlations in the data at a coarser granularity. The decoder layer, on the other hand, is responsible for generating predictions on different time scales and summing these results to obtain the final prediction. Thus, multiple time scales can be considered simultaneously. This is of especial importance for anomaly detection.
3.4.1 Dimension-episode-wise (DSW) embedding
Transformer [28] was originally designed to solve natural language processing problems, where each embedding vector in the original Transformer was a useful word. For multivariate temporal sequences, single-step durations provide limited information. As shown in Fig. 3, the DSW approach is utilized to embed different time-slice information, which contributes to more noteworthy information to be captured.
![]()
Figure 3.Difference between DSW embedding and conventional embedding approaches. DSW uses episodes of different features to predict different episodes of data with different features. While the conventional embedding approach uses all the features in the same time episode for embedding and does not take into account the correlation between the multivariate variables.
where
where the variable matrix
By using linear projection
This embedding process captures both the content and positional information of each episode. After embedding, a two-dimensional matrix
3.4.2 Two-stage attention (TSA) mechanism
The multivariate time-series data cannot be rotated and deflated as that done for images, because the directions of the dimension axis and the time axis have different meanings. The time axis must be split and trained in one direction. Meanwhile, self-attention also cannot be directly applied to two-dimensional matrices because it may lead to the “curse of dimensionality”, which is terrible for high-dimensional data processing. Therefore, our module uses the TSA mechanism to capture dimensional dependencies across time and between two-dimensional matrices. As shown in Fig. 4, different episodes are obtained by splitting the multivariate time-series data. The following embedding representation is derived:
![]()
Figure 4.Two-stage attention mechanism.
where
For the multivariate time-series episode embeddings
![]()
Figure 5.Comparison of (a) multi-headed self-attention mechanism and (b) our proposed router approach.
3.4.3 Hierarchical encoder-decoder (HED)
The HED approach is applied in the prediction module, because it is superior in extracting valid information and simultaneously filtering redundant and noisy data.
where
where
3.5 Automatic labeling module
There exist inherent drawbacks in the situation that a thresholding approach is used to identify anomalies, especially for data that is dynamic, has high uncertainty, or requires to consider contextual information. It is difficult to determine appropriate thresholds, which usually requires reliance on experience. Because different datasets and application scenarios may require different thresholds. Thresholding methods usually focus only on the numerical magnitude of the data itself and ignore the contextual information of the data. However, typically, in time-series data, anomalies may be associated with specific events. As a consequence, thresholding methods may not be able to capture this contextual information. To overcome this issue, we propose an automatic labeling module based on residual clustering, which benefits to effectively perform anomaly labeling.
Residuals denote the variations that cannot be explained by the prediction model. In an interval with large residuals, anomaly events may be hidden. Through clustering, these anomalies can be identified for further analysis or processing. Furthermore, our residual clustering approaches can identify different patterns or subgroups in the data. Meanwhile, residual clustering assists to uncover hidden features or relationships in the data. In high-dimensional situations, data usually contains multiple sub-populations or non-linear relationships, which makes it more difficult to be captured with a conventional model. As an unsupervised learning method, prior knowledge to anomaly labels is not necessary with our residual clustering. In the offshore wind turbine anomaly detection environment composed of multiple sensors, our method enables more efficient anomaly detection.
Given a set of residuals
where k is the number of clusters;
where
1) For expectation iteration
where
after the assignment, the value of J is non-increasing.
2) For maximization iteration
By fixing all
The Hessian matrix is constant positive definite and takes minimal values. Therefore, the value of J is also non-increasing after the assignment.
Obviously both the maximization iteration and expectation iteration objective functions are non-increasing (the algorithm stops if they are unchanged). It is demonstrated that our algorithm for the automatic labeling module can converge.
Our automatic labeling module can automatically identify possible anomalies based on the data with no need to explicitly define anomalous values. It first classifies the clustering into three categories. Such clustering makes the results easier to interpret and understand. Because normal conditions, minor anomalies, and severe anomalies can be better distinguished. Then the category with the largest prediction deviation (i.e., the largest cluster center value) is identified as an anomaly, which improves the accuracy of anomaly detection.
3.6 Overall model flow
Algorithm 1 shows how our overall model works. Following data cleansing, anomaly detection is performed by using the prediction module and the automatic labeling module. The modules of the Hawkeye are independent of each other and not stacked, working as a pipeline to finalize the anomaly detection.
| Dataset | Dimension | Train | Test | Contamination (%) |
| PSM | 27 | 30 | ||
| KDD99 | 41 | 20 | ||
| OWTD | 61 | 7 |
Table 1. Datasets description.
4 Experiments and evaluation
In this section, we compare Hawkeye with other baseline methods and present the analysis results. All methods mentioned are implemented by using Python 3.11 and conducted on the Intel Silver
4.1 Datasets
To demonstrate the effectiveness of our method, two datasets, including pooled server metrics (PSM) and the network anomaly dataset KDD Cup 1999 Data (KDD99) [29], and a real-world offshore wind turbine dataset (OWTD) are applied. As shown in Table 1, contamination refers to the proportion of anomalous data in a dataset. These two public datasets, PSM and KDD99, are data with anomalous labels, while OWTD is collected from a supervisory control and data acquisition (SCADA) system.
| Dataset | Dimension | Train | Test | Contamination (%) |
| PSM | 27 | 30 | ||
| KDD99 | 41 | 20 | ||
| OWTD | 61 | 7 |
Table 1. Datasets description.
4.2 Baselines
We compare our method with state-of-the-art methods including the local density-based LoF [5], the tree-based Isolation Forest [7], USAD [30] with prediction methods and adversarial networks, and the hyperplane segmentation-based OCSVM [6]. Because USAD is an unsupervised time-series anomaly detection method that uses automatic coding to extract features, meanwhile, LoF, Isolation Forest, and OCSVM are the classical methods used in offshore wind turbine anomaly detection systems. The modifiable open-source code is used to evaluate the baseline with the aim to eliminate runtime errors and inconsistencies in parameters.
4.3 Evaluation metric
Since in anomaly detection, data is often highly unbalanced, the weighted precision (P), weighted recall (R), and weighted F1-score (F1) are adopted as metrics for anomaly detection, which provides a fairer way to evaluate model performance because it considers each category’s true distribution. In addition, we analyzed the parameter file size of the model, a metric that measures the size of the model so that we can analyze the performance of each method on different datasets.
where the weight wi denotes the importance or prevalence of each class; Precisioni, Recalli, and F1-scorei are the precision, recall, and F1-score of class i, respectively; TPi, FPi, and FNi represent the true positives (TP), false positives (FP), and false negatives (FN) values for the i-th class.
High precision means that the model rarely misidentifies normal points as anomalies. As shown in Table 2, it is obvious that our model performs the best. For example, in the KDD99 dataset, the weighted precision of USAD is 69%, and the weighted precision of the other methods is even less, while that of our model is high to 89%. Compared with the worst LOF, the weighted precision of our method is 42% higher. As for the weighted recall, both OCSVM and our model are superior to the other methods. Moreover, our model is 2% higher than that of OCSVM. Our model’s F1-score on the PSM dataset improves by 16% over the best value achieved by the counterparts, and other metrics are all higher than those of the USAD and OCSVM algorithms. That is to say, our model achieved the highest performance in precise and simultaneously preferable performance in recall and F1-score. It is demonstrated that our model has high precision and sensitivity in anomaly detection, and it is also desirable in terms of the overall performance.
| KDD99 | PSM | ||||||
| P | R | P | R | ||||
| LoF | 0.47 | 0.23 | 0.26 | 0.58 | 0.54 | 0.56 | |
| OCSVM | 0.64 | 0.75 | 0.69 | 0.67 | 0.59 | 0.61 | |
| Isolation Forest | 0.49 | 0.30 | 0.37 | 0.72 | 0.65 | 0.66 | |
| USAD | 0.69 | 0.72 | 0.66 | 0.73 | 0.62 | 0.62 | |
| Ours | 0.89 | 0.77 | 0.79 | 0.77 | 0.77 | 0.77 | |
Table 2. Performance on labeled public datasets.
Fig. 6 compares the model file size of our model with those of other models at the situation with the largest F1-score. Although Isolation Forest exhibits a slightly smaller model file size in KDD99 than ours, F1-score of our model is 18% larger. Our model is able to obtain the largest F1-score with the smallest number of parameters in each dataset, achieving the best performance with minimal overhead.
![]()
Figure 6.Comparison of parameter file sizes.
Table 3 illustrates the anomaly detection results on real-world offshore wind turbine dataset. Our method detected 4.7% of anomalies on real-world datasets, while the results of Isolation Forest, USAD, LoF, and OCSVM are 16.0%, 10.1%, 20.0%, and 50.0%, respectively. Actually, the breakdown probability is not higher than 5.0% in practical applications. This means that Isolation Forest, USAD, and OCSVM are infeasible in our offshore wind turbine anomaly detection task.
| Ours | USAD | Isolation Forest | OCSVM | |
| Amount | 818 | |||
| Ratio (%) | 4.7 | 10.1 | 16.0 | 20.0 |
Table 3. Anomaly detection results on an offshore wind turbine dataset.
Fig. 7 illustrates the performance of our model in detecting anomalies on the real-world offshore wind turbine dataset. A high F1-score value is achieved by Hawkeya, owing to the use of residual-based automatic labeling techniques. This approach allows our model to effectively integrate the benefits of prediction-based model and clustering methods, ensuring precise anomaly detection without necessitating an increase in model complexity.
![]()
Figure 7.Anomaly detection results shown on two features: (a) L1L2 line voltage and (b) wind speed (mechanical).
5 Conclusions
In this paper, a novel unsupervised method, Hawkeye, is proposed for anomaly detection in multivariate time-series data. It involves clustering the residuals between predicted variables into three distinct categories and identifying the category with the largest residuals as anomalies. The accuracy of Hawkeye is experimentally evaluated on two publicly available datasets and the real-world offshore wind turbine operational dataset, which successfully demonstrated the feasibility of the proposed method. In the future, we will further enhance its performance and robustness for offshore wind turbine anomaly detection. Additionally, we will collaborate with domain experts to perform data labeling, thereby generating reliable datasets to advance the research in offshore wind turbine time-series anomaly detection.
Disclosures
The authors declare no conflicts of interest.
References
[1] L.F. Shen, Z.C. Li, J.T. Kwok, Timeseries anomaly detection using tempal hierarchical oneclass wk, in: Proc. of the 34th Conf. on Neural Infmation Processing Systems, Red Hook, USA, 2020, pp. 13016–13026.
[3] Thill M., Konen W., Wang H., Bäck T.. Temporal convolutional autoencoder for unsupervised anomaly detection in time series. Appl. Soft Comput., 112, 107751:1-22(2021).
[4] Krishna K., Murty M.N.. Genetic
[5] M.M. Breunig, H.P. Kriegel, R.T. Ng, J. Ser, LoF: Identifying densitybased local outliers, in: Proc. of ACM SIGMOD Intl. Conf. on Management of Data, Dallas, USA, 2000, pp. 93–104.
[6] Maglaras L.A., Jiang J.-M., Cruz T.J.. Combining ensemble methods and social network metrics for improving accuracy of OCSVM on intrusion detection in SCADA systems. J. Inf. Secur. Appl., 30, 15-26(2016).
[7] F.T. Liu, K.M. Ting, Z.H. Zhou, Isolation Fest, in: Proc. of the 8th IEEE Intl. Conf. on Data Mining, Pisa, Italy, 2008, pp. 413–422.
[9] Xu H., Caramanis C., Mannor S.. Outlier-robust PCA: The high-dimensional case. IEEE T. Inform. Theory, 59, 546-572(2012).
[10] S. Guha, N. Mishra, G. Roy, O. Schrijvers, Robust rom cut fest based anomaly detection on streams, in: Proc. of the 33rd Intl. Conf. on Machine Learning, New Yk, USA, 2016, pp. 2712–2721.
[12] A. Ryzhikov, M. Bisyak, A. Ustyuzhanin, D. Derkach, NFAD: Fixing anomaly detection using nmalizing flows [Online]. Available, https:arxiv.gabs1912.09323, November 2021.
[13] P.F. Marteau, S. SoheilyKhah, N. Béchet, Hybrid Isolation Fest―application to intrusion detection [Online]. Available, https:arxiv.gabs1705.03800, May 2017.
[14] S. Lee, T. Park, K. Lee, Soft contrastive learning f time series, in: Proc. of the 12th Intl. Conf. on Learning Representations, Vienna, Austria, 2024, pp. 1–25.
[15] H.J. Li, H.Z. Xu, W. Peng, C.R. Shen, X.W. Qiu, Multiscale sampling based MLP wks f anomaly detection in multivariate time series, in: Proc. of the IEEE 29th Intl. Conf. on Parallel Distributed Systems, Danzhou, China, 2023, pp. 1421–1428.
[16] C. Lin, J. Liu, K. Katsarou, S. Tahvili, Time series anomaly detection using convolutional neural wks in the manufacturing process of RAN, in: Proc. of IEEE Intl. Conf. on Artificial Intelligence Testing, Athens, Greece, 2023, pp. 90–98.
[17] Y. Su, Y.J. Zhao, C.H. Niu, R. Liu, W. Sun, D. Pei, Robust anomaly detection f multivariate time series through stochastic recurrent neural wk, in: Proc. of the 25th ACM SIGKDD Intl. Conf. on Knowledge Discovery & Data Mining, Anchage, USA, 2019, pp. 2828–2837.
[18] M.L. Shyu, S.C. Chen, K. Sarinnapakn, L.W. Chang, A novel anomaly detection scheme based on principal component classifier, in: Proc. of IEEE Foundations New Directions of Data Mining Wkshop, Piscataway, USA, 2003, pp. 172–179.
[20] J.H. Xu, H.X. Wu, J.M. Wang, M.S. Long, Anomaly transfmer: Time series anomaly detection with association discrepancy, in: Proc. of the 10th Intl. Conf. on Learning Representations, Virtual Event, 2022, pp. 1–20.
[21] Khan Z.A., Hussain T., Ullah A., Rho S., Lee M., Baik S.W.. Towards efficient electricity forecasting in residential and commercial buildings: A novel hybrid CNN with a LSTM-AE based framework. Sensors, 20, 1399:1-16(2020).
[22] Z.X. Wang, C.H. Pei, M.H. Ma, et al., Revisiting VAE f unsupervised time series anomaly detection: A frequency perspective, in: Proc. of ACM on Web Conf., Singape, 2024, pp. 3096–3105.
[23] H. Cheng, Q.S. Wen, Y. Liu, L. Sun, RobustTSF: Towards they design of robust time series fecasting with anomalies, in: Proc. of the Twelfth Intl Conf. on Learning Representations, Vienna, Austria, 2024, pp. 1–24.
[25] H.Z. Xu, Y.J. Wang, S.L. Jian, Q. Liao, Y.J. Wang, G.S. Pang, Calibrated oneclass classification f unsupervised time series anomaly detection, IEEE T. Knowl. Data Eng. (2024), doi: 10.1109TKDE.2024.3393996.
[26] Y.H. Zhang, J.C. Yan, Crossfmer: Transfmer utilizing crossdimension dependency f multivariate time series fecasting, in: Proc. of the 11th Intl. Conf. on Learning Representations, Kigali, Rwa, 2023, pp. 1–21.
[28] A. Vaswani, N. Shazeer, N. Parmar, et al., Attention is all you need, in: Proc. of the 31st Intl. Conf. on Neural Infmation Processing Systems, Long Beach, USA, 2017, pp. 6000–6010.
[29] UCI Machine Learning Reposity, KDD Cup 1999 Data [Online]. Available, https:www.kaggle.comdatasetsgalaxyhkddcup1999data, October 1999.
[30] J. Audibert, P. Michiardi, F. Guyard, S. Marti, M.A. Zuluaga, USAD: Unsupervised anomaly detection on multivariate time series, in: Proc. of the 26th ACM SIGKDD Intl. Conf. on Knowledge Discovery & Data Mining, Virtual Event, 2020, pp. 3395–3404.


Set citation alerts for the article
Please enter your email address

© Copyright 2018-2021 | Chinese Laser Press. All Rights Reserved 沪ICP备15018463号-20