Author Affiliations
1Hefei Institutes of Physical Science, Chinese Academy of Sciences, Hefei 230031, Anhui , China2University of Science and Technology of China, Hefei 230026, Anhui , China3Longyan Tobacco Industry Co., Ltd., Longyan 364030, Fujian , Chinashow less
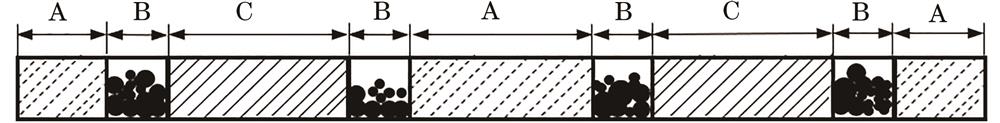
Fig. 1. Schematic diagram of activated carbon filter rods
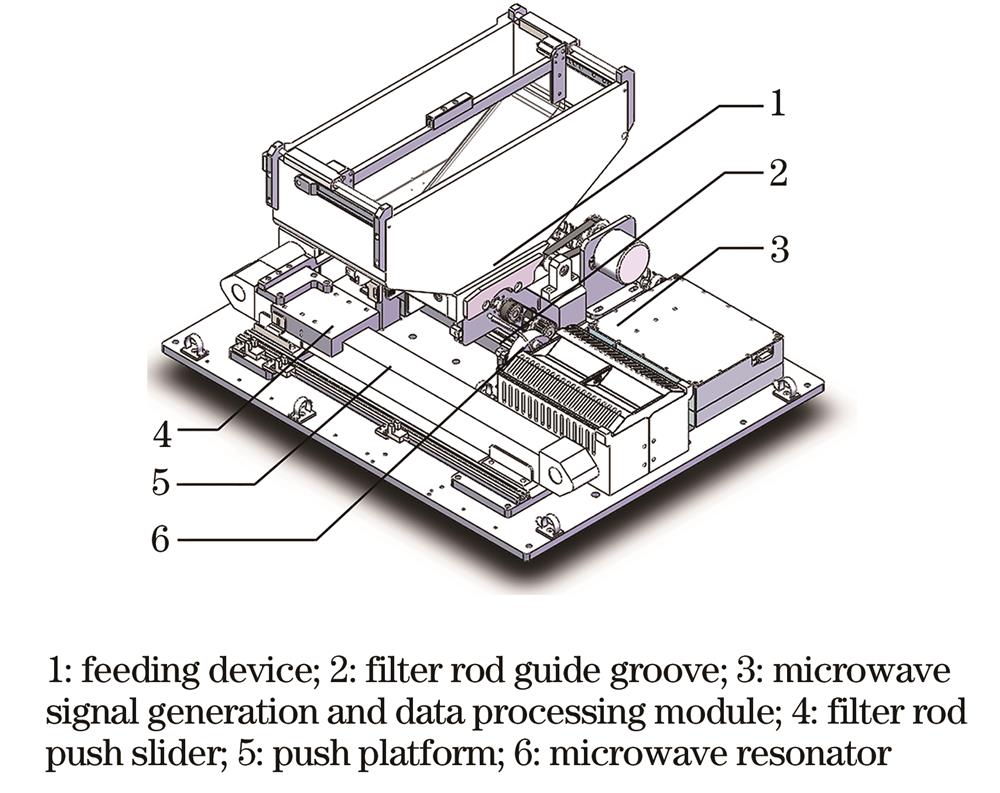
Fig. 2. Schematic diagram of activated carbon weight detection device
Fig. 3. Schematic diagram of the resonance curve and microwave amplitude change signal before and after perturbation of microwave resonator. (a) Resonance curve; (b) schematic diagram of a microwave amplitude change signal
Fig. 4. Data historgam
Fig. 5. Microwave signals before and after baseline correction
Fig. 6. Flow chart of peak height and peak area acquisition
Fig. 7. Eigenvalue extraction
Fig. 8. Support vector machine regression diagram
Fig. 9. Original microwave signal and baseline correction results
| Eigenvalue | Model formula |
|---|
| A | M=42.803A+34.418 | | H | M=40.089H+33.625 | | W | M=55.370W+35.171 | | AH | M=23.5507A+17.7795H+34.6415 | | AW | M=33.7886A+10.2371W+36.0585 | | HW | M=31.1707H+13.6721W+33.7931 | | AHW | M=24.7973A+14.8684W+4.2529W+34.1854 |
|
Table 1. Modeling results of activated carbon weight
| n | 19 | 17 | 15 | 13 | 11 | 9 | 7 |
|---|
| RSN /dB | 13.4944 | 13.3680 | 13.7638 | 11.8601 | 11.3876 | 11.8142 | 6.6117 | | RMSE | 0.02689 | 0.00335 | 0.00266 | 0.00300 | 0.00297 | 0.00267 | 0.03575 |
|
Table 2. Filtering results with different Gaussian window lengths
| Baseline correction algorithm | Variance |
|---|
| ASLS | 0.8649 | | AIRPLS | 0.7577 | | ARPLS | 0.5620 | | DRPLS | 0.3523 |
|
Table 3. Variance of the signal after removing characteristic peaks
method Modeling | SVR | PLS | BP |
|---|
| MAE /mg | R2 | RSD /% | MAE /mg | R2 | RSD /% | MAE /mg | R2 | RSD /% |
|---|
Unary regression | A | 0.7979 | 0.9924 | 1.4962 | 1.0492 | 0.9904 | 1.8462 | 1.0633 | 0.9898 | 1.8975 | | H | 1.2960 | 0.9797 | 2.1979 | 1.3205 | 0.9797 | 2.2553 | 1.3793 | 0.9807 | 2.3374 | | W | 3.2299 | 0.8533 | 5.9031 | 3.3309 | 0.8555 | 6.2243 | 3.4779 | 0.8453 | 6.4493 | | Multiple regression | AH | 0.8643 | 0.9921 | 1.5569 | 0.8880 | 0.9923 | 1.6042 | 0.9274 | 0.9918 | 1.7285 | | AW | 1.1155 | 0.9870 | 2.1967 | 1.0355 | 0.9905 | 1.8114 | 1.2560 | 0.9820 | 2.4971 | | HW | 1.1639 | 0.9845 | 2.1777 | 1.1527 | 0.9846 | 2.0913 | 1.2467 | 0.9818 | 2.3107 | | AHW | 0.8439 | 0.9918 | 1.6362 | 0.8950 | 0.9922 | 1.6094 | 0.9714 | 0.9863 | 1.8172 |
|
Table 4. Comparison of prediction effects of different modeling methods
| Serial number | M1 | M2 | M3 | M4 |
|---|
| 1 | 39.75 | 56.71 | 60.33 | 70.01 | | 2 | 38.83 | 54.12 | 60.92 | 72.00 | | 3 | 40.66 | 54.60 | 57.20 | 70.70 | | 4 | 39.99 | 54.13 | 56.42 | 70.54 | | 5 | 37.88 | 58.33 | 57.60 | 70.27 | | 6 | 37.92 | 56.51 | 60.67 | 71.08 | | 7 | 39.41 | 53.28 | 55.51 | 68.86 | | 8 | 39.77 | 53.19 | 56.29 | 68.86 | | 9 | 38.09 | 55.24 | 58.27 | 72.17 | | 10 | 38.83 | 55.33 | 57.18 | 71.28 | | Weight value | 39.2 | 55.3 | 58.9 | 70.1 | | Standard deviation | 0.91 | 1.56 | 1.85 | 1.08 |
|
Table 5. Repeatability of activated carbon weight detection (n=10)
| Serial number | Absolute error /mg | | Relative error /% |
|---|
| Location 1 | Location 2 | Location 3 | Location 4 | | Location 1 | Location 2 | Location 3 | Location 4 |
|---|
| 1 | 0.55 | 1.41 | 1.43 | 0.09 | | 1.39 | 2.56 | 2.43 | 0.13 | | 2 | 0.37 | 1.18 | 2.02 | 1.90 | | 0.93 | 2.13 | 3.42 | 2.72 | | 3 | 1.46 | 0.70 | 1.70 | 0.60 | | 3.73 | 1.26 | 2.89 | 0.86 | | 4 | 0.79 | 1.17 | 2.48 | 0.44 | | 2.02 | 2.12 | 4.21 | 0.62 | | 5 | 1.32 | 3.03 | 1.30 | 0.17 | | 3.36 | 5.47 | 2.21 | 0.24 | | 6 | 1.28 | 1.21 | 1.77 | 0.98 | | 3.26 | 2.20 | 3.01 | 1.39 | | 7 | 0.21 | 2.02 | 3.39 | 1.24 | | 0.53 | 3.66 | 5.76 | 1.78 | | 8 | 0.57 | 2.11 | 2.61 | 1.24 | | 1.44 | 3.82 | 4.43 | 1.76 | | 9 | 1.11 | 0.06 | 0.63 | 2.07 | | 2.83 | 0.12 | 1.07 | 2.95 | | 10 | 0.37 | 0.03 | 1.72 | 1.18 | | 0.95 | 0.05 | 2.92 | 1.69 | | Weight value | 39.2 | 55.3 | 58.9 | 70.1 | | 39.2 | 55.3 | 58.9 | 70.1 | | Average value | 0.80 | 1.29 | 1.91 | 0.99 | | 2.05 | 2.34 | 3.23 | 1.41 |
|
Table 6. Precision results of activated carbon weight detection