• Infrared and Laser Engineering
  • Vol. 52, Issue 3, 20220470 (2023)
Lili Dong1, Qing Gao2, Jiasen Wu2, Xiangyu Xia2..., Shiming Liu2 and Junshan Xiu2,*|Show fewer author(s)
Author Affiliations
  • 1School of Chemistry and Chemical Engineering, Shandong University of Technology, Zibo 255000, China
  • 2School of Physics and Optoelectronic Engineering, Shandong University of Technology, Zibo 255000, China
  • show less
    DOI: 10.3788/IRLA20220470 Cite this Article
    Lili Dong, Qing Gao, Jiasen Wu, Xiangyu Xia, Shiming Liu, Junshan Xiu. Rapid quantitative analysis of ZnGa2O4(GZO) thin films using picosecond laser induced breakdown spectroscopy[J]. Infrared and Laser Engineering, 2023, 52(3): 20220470 Copy Citation Text show less
    Transmittance of GZO films at different sputtering powers
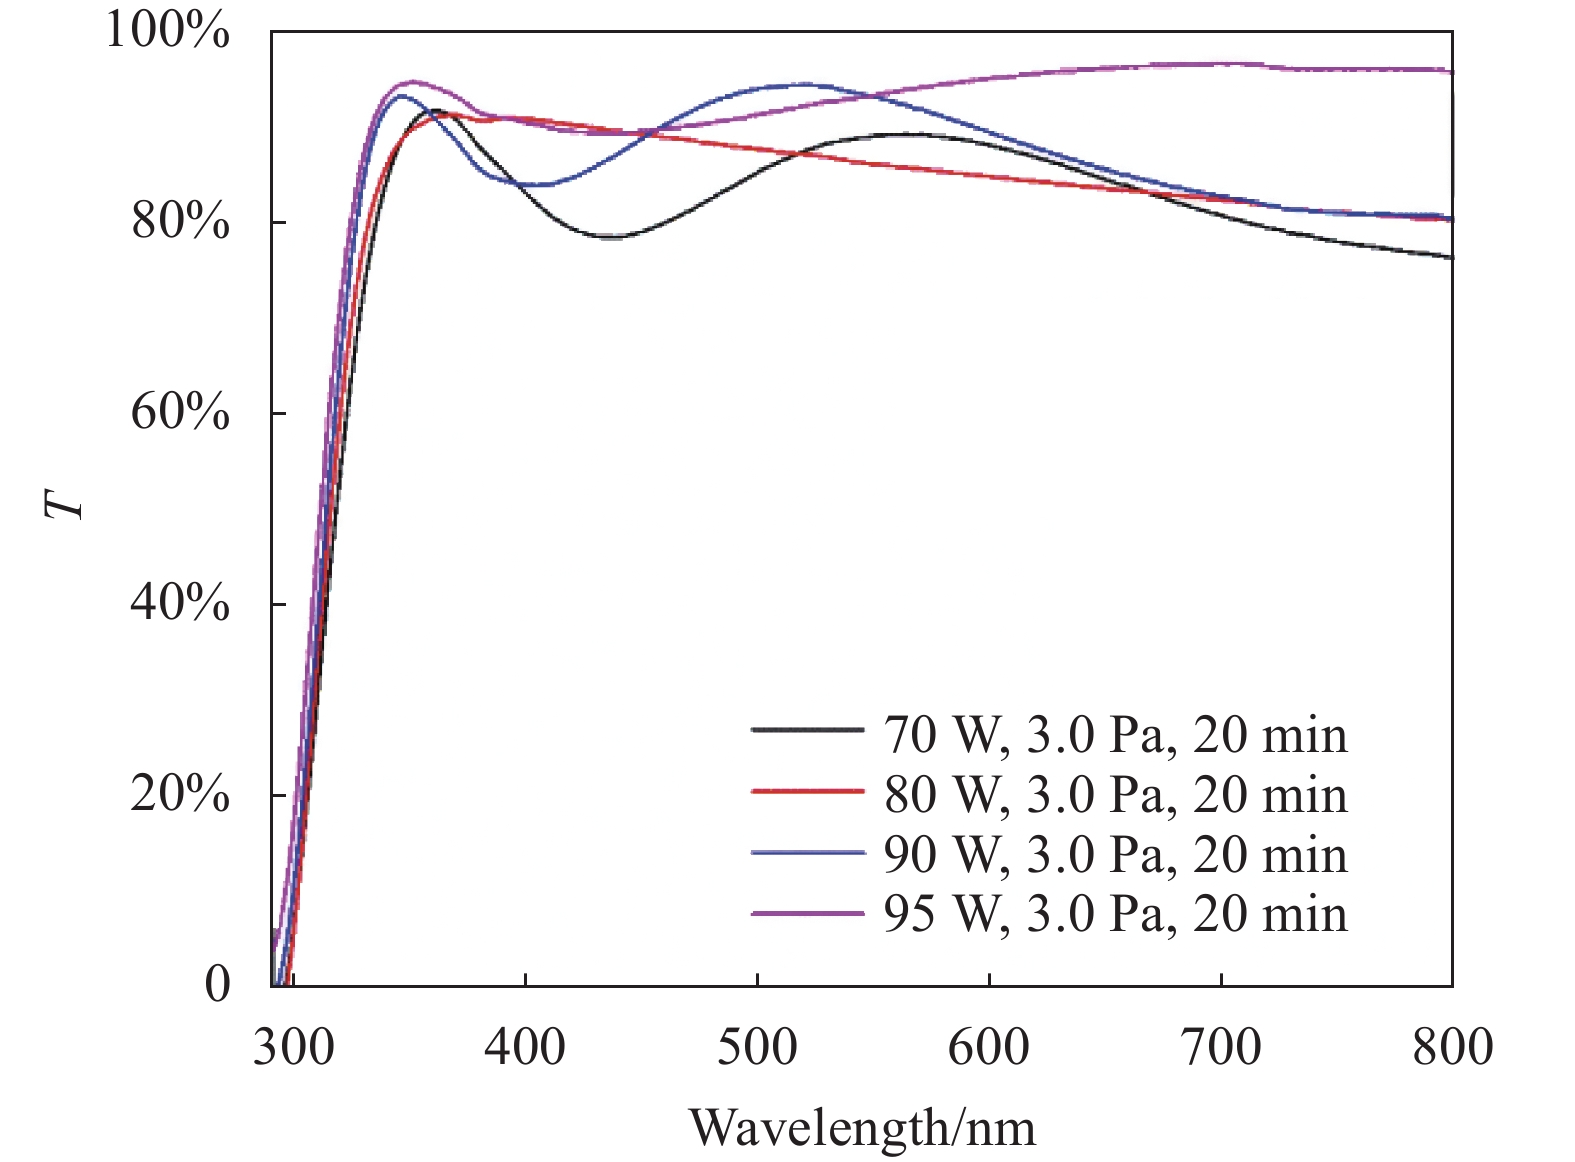
    Fig. 1. Transmittance of GZO films at different sputtering powers
    Optical band gap widths of GZO films at different sputtering powers
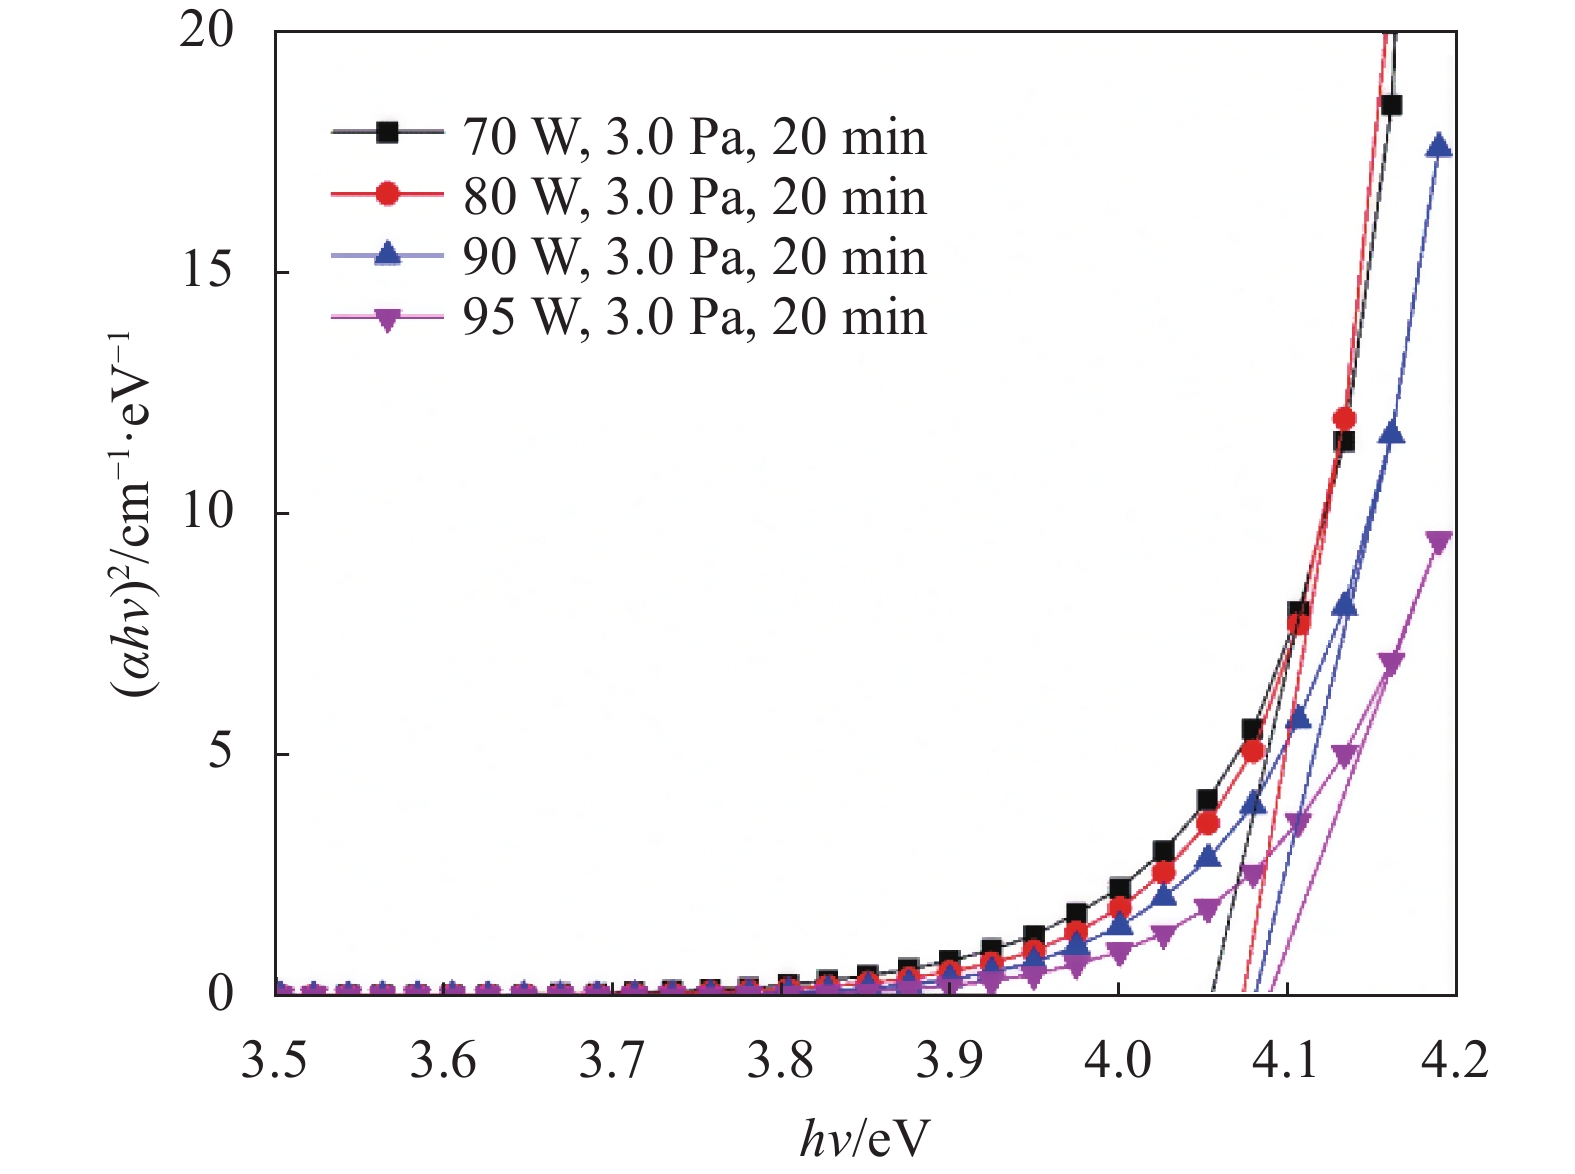
    Fig. 2. Optical band gap widths of GZO films at different sputtering powers
    Schematic diagram of PS-LIBS experimental set up
    Fig. 3. Schematic diagram of PS-LIBS experimental set up
    Typical LIBS spectra of GZO thin films
    Fig. 4. Typical LIBS spectra of GZO thin films
    Boltzmann diagram obtained from Ga lines
    Fig. 5. Boltzmann diagram obtained from Ga lines
    Voigt fitting of Ga lines I 403.29 nm
    Fig. 6. Voigt fitting of Ga lines I 403.29 nm
    Intensity variation of Ga lines I 403.29 nm at different positions
    Fig. 7. Intensity variation of Ga lines I 403.29 nm at different positions
    Zn/Ga spectral line intensity ratio and atomic concentration ratio of GZO films at different sputtering powers
    Fig. 8. Zn/Ga spectral line intensity ratio and atomic concentration ratio of GZO films at different sputtering powers
    Zn/Ga calibration curves of GZO films at different sputtering powers
    Fig. 9. Zn/Ga calibration curves of GZO films at different sputtering powers
    Sputtering parametersAtomic concentration ratios
    Power/WZnGaOZn/Ga
    702.539.7887.690.259
    802.329.5888.090.242
    902.7311.6485.630.235
    952.9313.3283.740.220
    Table 1. EDS data of GZO films at different sputtering powers
    ElementNumber of linesWavelength at the peak positions/nm
    Ga I3287.42, 294.36, 403.29
    Zn I3328.23, 330.26, 334.50
    Table 2. Spectral lines of target elements
    ElementsSpectral lines/nmAtomic spectral lines data
    Aki/s−1Ek/eV gk
    Ga I287.421.17×1084.31234
    294.364.02×1084.31312
    403.294.85×1073.07342
    Table 3. Spectral lines data of Ga using to calculate the plasma temperature
    Lili Dong, Qing Gao, Jiasen Wu, Xiangyu Xia, Shiming Liu, Junshan Xiu. Rapid quantitative analysis of ZnGa2O4(GZO) thin films using picosecond laser induced breakdown spectroscopy[J]. Infrared and Laser Engineering, 2023, 52(3): 20220470
    Download Citation