• Infrared and Laser Engineering
  • Vol. 51, Issue 7, 20210590 (2022)
Zefu Xu1, Huijie Zhao1,2, and Guorui Jia1,2,*
Author Affiliations
  • 1School of Instrumentation and Optoelectronic Engineering, Beihang University, Beijing 100191, China
  • 2Key Laboratory of "Precision Opto-mechatronics Technology" Ministry of Education, Beihang University, Beijing 100191, China
  • show less
    DOI: 10.3788/IRLA20210590 Cite this Article
    Zefu Xu, Huijie Zhao, Guorui Jia. Influence of the AOTF rear cut angle on spectral image quality[J]. Infrared and Laser Engineering, 2022, 51(7): 20210590 Copy Citation Text show less
    Wave vector layout of momentum matching
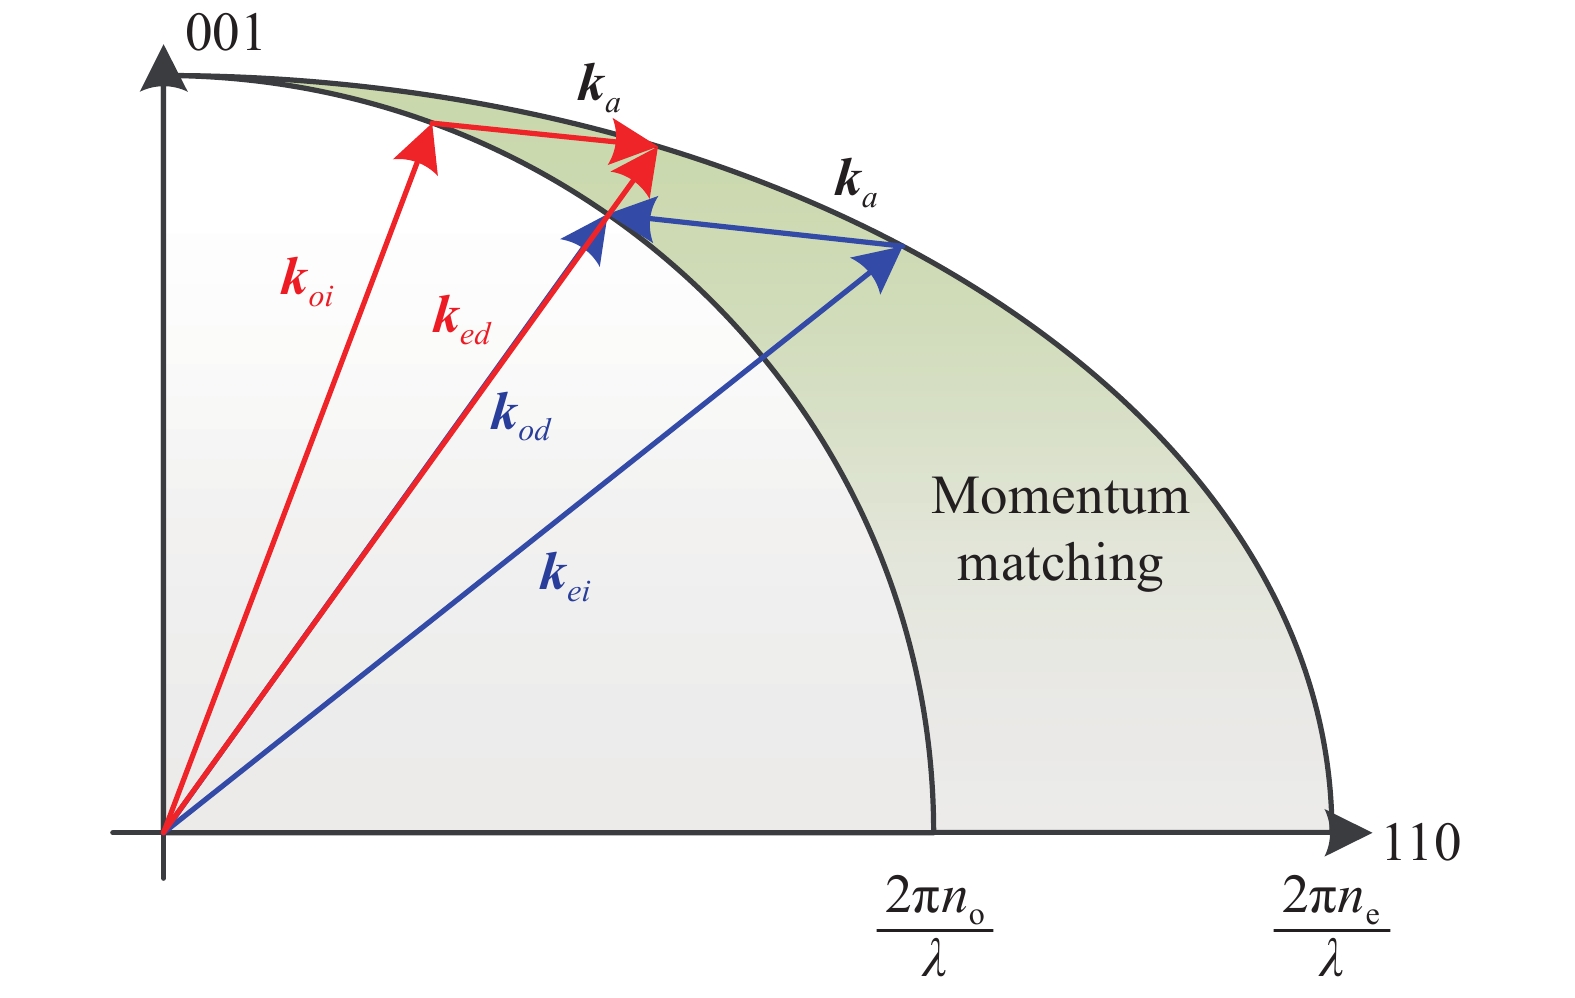
    Fig. 1. Wave vector layout of momentum matching
    Acousto-optic interaction of non ideal sound beam
    Fig. 2. Acousto-optic interaction of non ideal sound beam
    Acousto-optic interaction of AOTF and dispersion of rear cut angle
    Fig. 3. Acousto-optic interaction of AOTF and dispersion of rear cut angle
    (a) Response of spectrum-space dimensional (red line), spectral response (blue line), spatial response (green line) at 59.6 MHz (central wavelength 750 nm); (b) MTF curve, blue line is Fourier transform of 59.6 MHz spatial response, red line is measured MTF by oblique knife edge target; (c) Deviation between the measured MTF and the theoretical MTF @59.6 MHz; (d) Spectral image of 59.6 MHz; (e) Response of spectrum-space dimensional (red line), spectral response (blue line), spatial response (green line) at 99.4 MHz (central wavelength 500 nm); (f) MTF curve, blue line is Fourier transform of 99.4 MHz spatial response, red line is measured MTF by oblique knife edge target; (g) Deviation between the measured MTF and the theoretical MTF @99.4 MHz; (h) Spectral image of 99.4 MHz
    Fig. 4. (a) Response of spectrum-space dimensional (red line), spectral response (blue line), spatial response (green line) at 59.6 MHz (central wavelength 750 nm); (b) MTF curve, blue line is Fourier transform of 59.6 MHz spatial response, red line is measured MTF by oblique knife edge target; (c) Deviation between the measured MTF and the theoretical MTF @59.6 MHz; (d) Spectral image of 59.6 MHz; (e) Response of spectrum-space dimensional (red line), spectral response (blue line), spatial response (green line) at 99.4 MHz (central wavelength 500 nm); (f) MTF curve, blue line is Fourier transform of 99.4 MHz spatial response, red line is measured MTF by oblique knife edge target; (g) Deviation between the measured MTF and the theoretical MTF @99.4 MHz; (h) Spectral image of 99.4 MHz
    (a) MTF of 59.6 MHz (central wavelength 750 nm) with different rear cut angles; (b) MTF of 99.4 MHz (central wavelength 500 nm) with different rear cut angles
    Fig. 5. (a) MTF of 59.6 MHz (central wavelength 750 nm) with different rear cut angles; (b) MTF of 99.4 MHz (central wavelength 500 nm) with different rear cut angles
    99.4 MHz59.6 MHz
    Rear cut angle/(°)Spatial frequency/cycles·mm−1 @MTF30 Rear cut angle/(°)Spatial frequency/cycles·mm−1 @ MTF30
    875.9855.7
    645.6650.9
    432.6447.1
    225.6243.4
    021.0040.2
    −217.7−237.4
    −415.3−434.7
    −4.814.5−4.833.7
    −611.7−632.2
    −87.2−829.9
    Table 1. MTF30 with different rear cut angles at 99.4 MHz (center wavelength 500 nm) and 59.6 MHz (center wavelength 750 nm)
    Zefu Xu, Huijie Zhao, Guorui Jia. Influence of the AOTF rear cut angle on spectral image quality[J]. Infrared and Laser Engineering, 2022, 51(7): 20210590
    Download Citation