Author Affiliations
1College of Computer Sciences and Technology, Taiyuan University of Science and Technology, Taiyuan 030024, Shanxi , China2National Laboratory of Pattern Recognition, Institute of Automation, Chinese Academy of Sciences, Beijing 100190, Chinashow less
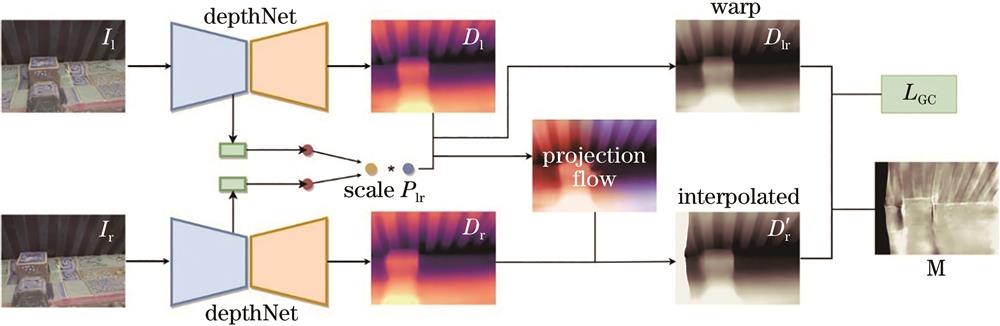
Fig. 1. Schematic of learning depth algorithm using stereo image pairs
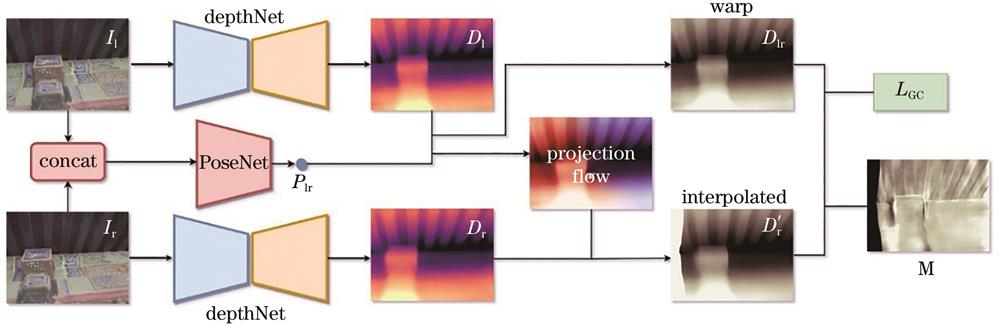
Fig. 2. Schematic of learning depth algorithm using online motion estimation
Fig. 3. Schematic of direct depth comparison algorithm
Fig. 4. Flowchart of 3D point cloud comparison
Fig. 5. Depth maps estimated by stereo image pair method
Fig. 6. Some typical architectural parts for testing
Fig. 7. Mean value and standard deviation of the absolute depth error for the 15 typical scenes under the stereo image pair model and the motion estimation model
Fig. 8. Depth maps and its error maps of the two models with large error
Fig. 9. Depth maps and its error maps of the two models with small error
Fig. 10. Mean value and standard deviation of the distance errors from the predicted point cloud to the ground truth after ICP registration optimization
Fig. 11. Error distribution of point cloud(better result). (a) Stereo image pair model; (b) motion estimation model
Fig. 12. Error distribution of point cloud(poor result). (a) Stereo image pair model; (b) motion estimation model
| Evaluating index | Definition |
|---|
| | | | | | | | | |
|
Table 1. Used 7 different evaluation indexes
| Scene | Parameter | AbsE | AbsRel | RMSElog | RMSE | δ1 | δ2 | δ3 |
|---|
| S-DN | P-DN | S-DN | P-DN | S-DN | P-DN | S-DN | P-DN | S-DN | P-DN | S-DN | P-DN | S-DN | P-DN |
|---|
| S1 | Mean | 92.059 | 69.396 | 0.044 | 0.033 | 0.019 | 0.015 | 130.047 | 101.968 | 0.992 | 0.996 | 0.998 | 0.999 | 0.999 | 0.999 | | Std | 20.119 | 13.009 | 0.011 | 0.008 | 0.004 | 0.003 | 30.701 | 26.728 | 0.012 | 0.007 | 0.005 | 0.003 | 0.002 | 0.002 | | S2 | Mean | 142.004 | 85.449 | 0.069 | 0.042 | 0.031 | 0.018 | 218.779 | 134.206 | 0.939 | 0.986 | 0.986 | 0.997 | 0.998 | 1.000 | | Std | 85.910 | 50.506 | 0.033 | 0.022 | 0.017 | 0.010 | 104.946 | 56.033 | 0.086 | 0.017 | 0.021 | 0.004 | 0.005 | 0.001 | | S3 | Mean | 76.176 | 47.532 | 0.143 | 0.062 | 0.044 | 0.026 | 172.549 | 116.678 | 0.890 | 0.970 | 0.967 | 0.987 | 0.986 | 0.991 | | Std | 47.523 | 33.026 | 0.104 | 0.036 | 0.027 | 0.015 | 134.621 | 79.858 | 0.107 | 0.075 | 0.036 | 0.02 | 0.018 | 0.012 | | S4 | Mean | 81.869 | 53.993 | 0.053 | 0.037 | 0.023 | 0.016 | 118.610 | 84.116 | 0.985 | 0.991 | 0.995 | 0.999 | 0.998 | 0.999 | | Std | 27.412 | 18.137 | 0.018 | 0.013 | 0.008 | 0.005 | 46.794 | 31.098 | 0.022 | 0.012 | 0.011 | 0.003 | 0.005 | 0.001 | | S5 | Mean | 79.434 | 53.465 | 0.048 | 0.035 | 0.021 | 0.015 | 127.196 | 87.650 | 0.986 | 0.990 | 0.995 | 0.998 | 0.999 | 0.999 | | Std | 13.332 | 15.185 | 0.007 | 0.011 | 0.003 | 0.005 | 28.824 | 31.470 | 0.012 | 0.009 | 0.005 | 0.003 | 0.002 | 0.001 | | S6 | Mean | 73.650 | 51.223 | 0.060 | 0.044 | 0.024 | 0.018 | 146.474 | 121.922 | 0.977 | 0.981 | 0.986 | 0.988 | 0.993 | 0.995 | | Std | 32.010 | 24.641 | 0.034 | 0.026 | 0.009 | 0.008 | 102.214 | 92.644 | 0.021 | 0.018 | 0.016 | 0.013 | 0.012 | 0.009 | | S7 | Mean | 147.347 | 77.696 | 0.119 | 0.061 | 0.040 | 0.023 | 262.657 | 153.315 | 0.941 | 0.969 | 0.960 | 0.984 | 0.968 | 0.990 | | Std | 77.375 | 39.067 | 0.099 | 0.046 | 0.024 | 0.014 | 199.390 | 110.325 | 0.073 | 0.039 | 0.062 | 0.025 | 0.052 | 0.017 | | S8 | Mean | 61.501 | 45.311 | 0.059 | 0.039 | 0.024 | 0.017 | 112.967 | 91.378 | 0.965 | 0.987 | 0.991 | 0.994 | 0.995 | 0.997 | | Std | 29.071 | 15.768 | 0.036 | 0.016 | 0.013 | 0.007 | 52.998 | 42.383 | 0.048 | 0.019 | 0.015 | 0.012 | 0.009 | 0.008 | | S9 | Mean | 61.198 | 57.930 | 0.036 | 0.034 | 0.016 | 0.015 | 89.288 | 82.843 | 0.991 | 0.995 | 0.999 | 0.999 | 1.000 | 1.000 | | Std | 17.013 | 13.090 | 0.011 | 0.007 | 0.004 | 0.003 | 25.556 | 19.684 | 0.013 | 0.006 | 0.003 | 0.002 | 0.001 | 0.000 | | S10 | Mean | 98.554 | 79.701 | 0.057 | 0.046 | 0.024 | 0.020 | 148.852 | 118.570 | 0.979 | 0.988 | 0.995 | 0.999 | 0.999 | 1.000 | | Std | 28.063 | 27.118 | 0.019 | 0.016 | 0.008 | 0.007 | 39.469 | 35.626 | 0.024 | 0.014 | 0.006 | 0.002 | 0.002 | 0.001 | | S11 | Mean | 112.137 | 94.995 | 0.053 | 0.045 | 0.022 | 0.020 | 171.664 | 149.130 | 0.984 | 0.986 | 0.997 | 0.998 | 0.999 | 1.000 | | Std | 16.456 | 21.645 | 0.008 | 0.009 | 0.003 | 0.004 | 30.734 | 31.393 | 0.011 | 0.010 | 0.006 | 0.003 | 0.002 | 0.001 | | S12 | Mean | 60.529 | 46.035 | 0.065 | 0.044 | 0.024 | 0.018 | 111.509 | 89.939 | 0.967 | 0.981 | 0.988 | 0.993 | 0.992 | 0.995 | | Std | 67.468 | 39.070 | 0.155 | 0.057 | 0.030 | 0.016 | 102.026 | 68.838 | 0.069 | 0.050 | 0.048 | 0.031 | 0.040 | 0.026 | | S13 | Mean | 67.791 | 51.239 | 0.043 | 0.034 | 0.019 | 0.015 | 109.101 | 89.085 | 0.989 | 0.992 | 0.996 | 0.998 | 0.998 | 0.999 | | Std | 21.200 | 14.242 | 0.013 | 0.010 | 0.005 | 0.004 | 37.649 | 34.578 | 0.011 | 0.009 | 0.007 | 0.004 | 0.006 | 0.003 | | S14 | Mean | 138.875 | 62.554 | 0.056 | 0.026 | 0.025 | 0.011 | 161.117 | 83.849 | 0.996 | 0.999 | 0.999 | 1.000 | 1.000 | 1.000 | | Std | 49.425 | 10.958 | 0.017 | 0.004 | 0.008 | 0.002 | 47.469 | 13.856 | 0.009 | 0.002 | 0.002 | 0.000 | 0.001 | 0.000 | | S15 | Mean | 37.833 | 31.337 | 0.044 | 0.035 | 0.017 | 0.015 | 76.269 | 58.719 | 0.985 | 0.988 | 0.992 | 0.994 | 0.996 | 0.998 | | Std | 20.797 | 16.653 | 0.033 | 0.022 | 0.009 | 0.008 | 64.297 | 38.356 | 0.026 | 0.024 | 0.021 | 0.015 | 0.013 | 0.007 |
|
Table 2. Comparison results of the stereo image pair model and the motion estimation model under the 7 indicators
| Scene | Mean-ICP P-DN | Std-ICP P-DN | Mean-ICP S-DN | Std-ICP- S-DN |
|---|
| S1 | 52.8 | 22.1 | 60.8 | 15.7 | | S2 | 110.2 | 30.1 | 112.2 | 20.0 | | S3 | 40.0 | 13.8 | 52.8 | 39.9 | | S4 | 49.2 | 15.9 | 47.4 | 15.4 | | S5 | 50.9 | 26.1 | 51.9 | 33.1 | | S6 | 60.1 | 37.9 | 59.4 | 37.0 | | S7 | 49.6 | 17.1 | 52.4 | 14.5 | | S8 | 33.4 | 21.0 | 41.92 | 23.5 | | S9 | 40.4 | 9.8 | 53.7 | 13.1 | | S10 | 150.8 | 14.5 | 154.2 | 21.0 | | S11 | 134.0 | 22.9 | 128.8 | 26.1 | | S12 | 54.3 | 21.4 | 54.9 | 22.5 | | S13 | 47.0 | 14.3 | 44.67 | 12.0 | | S14 | 54.9 | 12.3 | 55.7 | 12.3 | | S15 | 27.0 | 16.7 | 29.3 | 16.0 |
|
Table 3. Mean value and standard deviation of the distance errors from the predicted point cloud to the ground truth under the 15 typical scenes