
Saisai Wang, Pengfei Shao, Ting Zhi, Zhujun Gao, Wenhao Chen, Lin Hao, Qing Cai, Jin Wang, Junjun Xue, Bin Liu, Dunjun Chen, Lianhui Wang, Rong Zhang, "Structural designs of AlGaN/GaN nanowire-based photoelectrochemical photodetectors: carrier transport regulation in GaN segment as current flow hub," Adv. Photon. Nexus 2, 036003 (2023)
- Advanced Photonics Nexus
- Vol. 2, Issue 3, 036003 (2023)

Fig. 1. (a) The schematic structure of the 160 nm p-AlGaN/140 nm n-GaN NWs. The far left inset is the STEM image of an individual NW, and the upper left inset is the top-view SEM image of the NWs. Operation mechanisms of the PEC PD under (b) 255 nm and (c) 365 nm illuminations, including energy band diagrams, carrier transport, and chemical reactions. The solid arrows refer to the dominant charge transfer processes. (d) The LSV curve of the PEC PD with 160 nm p-AlGaN/140 nm n-GaN NWs at dark.
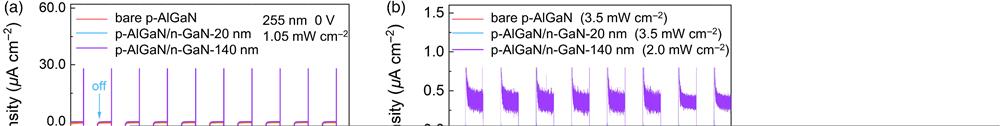
Fig. 2. Photocurrent densities of the three constructed 160 nm p-AlGaN-based PEC PDs with 0, 20, and 140 nm n-GaN segments (namely, bare p-AlGaN, p-AlGaN/n-GaN-20 nm, and p-AlGaN/n-GaN-140 nm) under (a) 255 nm and (b) 365 nm illuminations. The response time (
Fig. 3. PEC measurements of the constructed PEC PD with 160 nm p-AlGaN/140 nm n-GaN NWs. Photoresponses under (a) 255 nm and (b) 365 nm illuminations with various light intensities (0 V). (c) Photocurrents of the PEC PD under different biases (255 nm light). (d) LSV curve with a 30-s sampling interval under 365 nm illumination.
Fig. 4. (a) Schematic structure of the 160 nm p-AlGaN/140 nm n-GaN NWs with Pt decoration grown on the Si substrate. (b), (c) Overview of the STEM images of the Pt/160 nm p-AlGaN/140 nm n-GaN NWs. (d) The energy-dispersive spectroscopy (EDS) elemental mapping images of the Pt/AlGaN/GaN structure.
Fig. 5. Photoresponses of the PD with Pt/160 nm p-AlGaN/140 nm n-GaN NWs under (a) various irradiation intensities and (b) different biases. (c) Response time and recovery time of the PEC PD with Pt modification at 255 nm illumination. (d), (e) Responses comparison of the PEC PD with 160 nm p-AlGaN/140 nm n-GaN with and without Pt decoration. (f) Comparison of EIS curves at dark in these constructed PEC PDs.
Fig. 6. (a), (b) Long-time on/off cyclic photocurrent measurements of 160 nm p-AlGaN/140 nm n-GaN nanostructures under 255 nm illumination with an irradiation intensity of
|
Table 1. Performance comparison between our constructed PDs and other recently reported PDs.


Set citation alerts for the article
Please enter your email address

© Copyright 2018-2021 | Chinese Laser Press. All Rights Reserved 沪ICP备15018463号-20