- Spectroscopy and Spectral Analysis
- Vol. 42, Issue 2, 561 (2022)
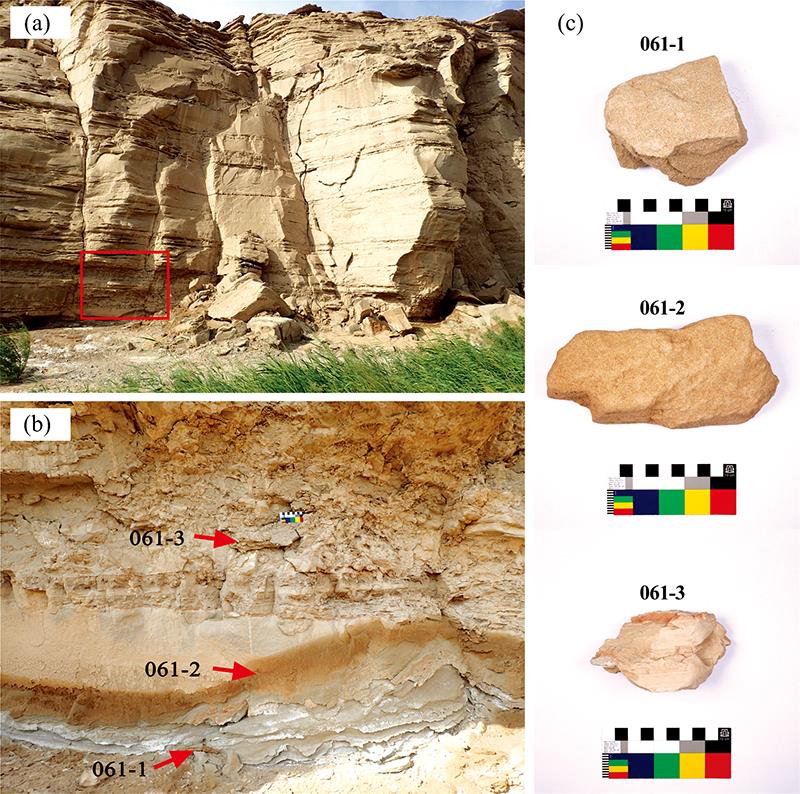
Fig. 1. Sample collection position and photos of samples
(a): Weathering at the bottom of Yardang near the No.2 water source of Dahaidao; (b): Sample collection position; (c): Photos of samples
(a): Weathering at the bottom of Yardang near the No.2 water source of Dahaidao; (b): Sample collection position; (c): Photos of samples

Fig. 2. Photos of three samples under orthogonal polarization and single polarization
061-1, 061-2: 100X; 061-3: 250X
061-1, 061-2: 100X; 061-3: 250X
Fig. 3. X-ray diffraction patterns of 061-1 (a), 061-2 (b) and 061-3 (c)
Fig. 4. Pore size distribution of three samples
Fig. 5. SEM photos of salt crystallization of three samples
Fig. 6. FTIR spectra of salts from three samples
Fig. 7. Raman spectra of salts from three samples
(a): 061-1; (b): 061-2; (c): 061-3
(a): 061-1; (b): 061-2; (c): 061-3
| |||||||||||||||||||||||||||||||||||||||||||||||
Table 1. XRD semi quantitative analysis results of three rock samples(%)
| |||||||||||||||||||||||||||||||||||||||||||
Table 2. Ion chromatography analysis results of three samples(mg·L-1)
|
Table 3. EDS analysis results of salt crystallization of three samples(Wt%)
|
Table 4. The infrared spectra of characteristic peaks of NO 3 - O 4 2 -
|
Table 5. The Raman spectra of characteristic peaks of NO 3 - O 4 2 -

Download Citation


Set citation alerts for the article
Please enter your email address

© Copyright 2018-2021 | Chinese Laser Press. All Rights Reserved 沪ICP备15018463号-20